Fig. 2.
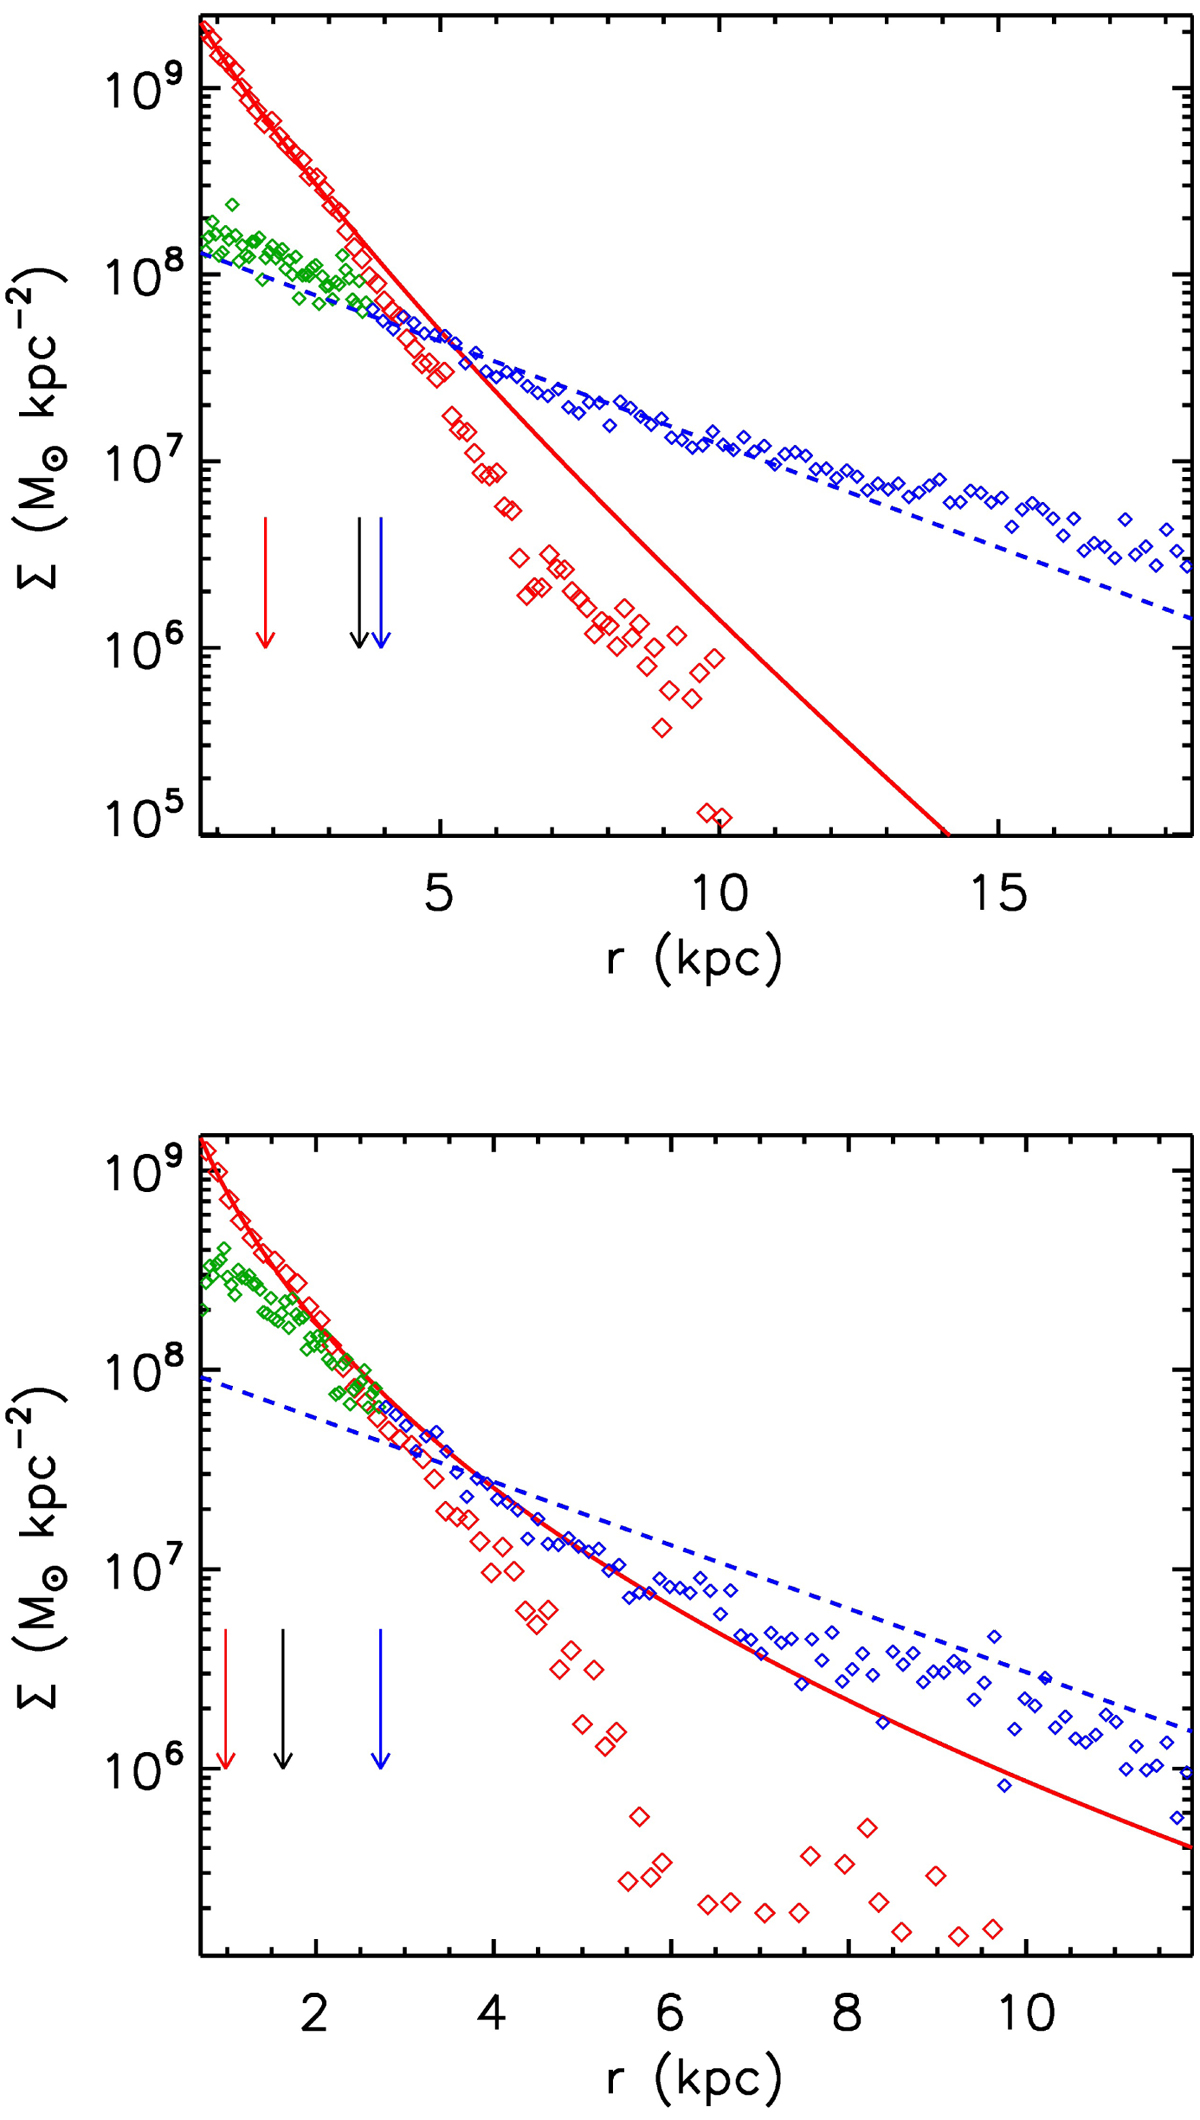
Projected stellar-mass surface density profiles for bulge (red diamonds) and disc components (blue diamonds) of two typical simulated ETGs. The regions of the discs that co-exist with spheroid components are highlighted (green diamonds). The best-fitted Sérsic profiles for the spheroid components (solid red lines) and the exponential profiles for the discs (dashed blue lines) are also included. The bulge effective radius (Reff, calculated by using Eq. (6) in Sáiz et al. 2001), the Rhm and the Rd are depicted with red, black and blue arrows, respectively. In the upper panel, the inner disc follows the exponential profile (n ∼ 1.25) while in the lower panel, the same component follows the bulge profile (n ∼ 2.78). A variety of behaviours is detected, suggesting different contributions of processes such as collapse, mergers and secular evolution.
Current usage metrics show cumulative count of Article Views (full-text article views including HTML views, PDF and ePub downloads, according to the available data) and Abstracts Views on Vision4Press platform.
Data correspond to usage on the plateform after 2015. The current usage metrics is available 48-96 hours after online publication and is updated daily on week days.
Initial download of the metrics may take a while.