| Issue |
A&A
Volume 629, September 2019
|
|
|---|---|---|
| Article Number | C2 | |
| Number of page(s) | 2 | |
| Section | Galactic structure, stellar clusters and populations | |
| DOI | https://doi.org/10.1051/0004-6361/201832787e | |
| Published online | 04 September 2019 | |
Search for Galactic runaway stars using Gaia Data Release 1 and HIPPARCOS proper motions (Corrigendum)
1
Centro de Astrobiología CSIC-INTA, Campus ESAC, Camino bajo del castillo s/n, 28 692 Villanueva de la Cañada, Spain
e-mail: jmaiz@cab.inta-csic.es
2
Departamento de Astrofísica y Física de la Atmósfera, Universidad Complutense de Madrid, 28 040 Madrid, Spain
3
Departamento de Física y Astronomía, Universidad de La Serena, Av. Cisternas 1200 Norte, La Serena, Chile
4
Instituto de Astrofísica de Canarias, 38 200 La Laguna, Tenerife, Spain
5
Departamento de Astrofísica, Universidad de La Laguna, 38 205 La Laguna, Tenerife, Spain
6
Departamento de Física, Ingeniería de Sistemas y Teoría de la Señal, Escuela Politécnica Superior, Universidad de Alicante, Carretera San Vicente del Raspeig s/n, 03 690 San Vicente del Raspeig, Spain
7
ESA, European Space Astronomy Centre, Camino bajo del castillo s/n, 28 692 Villanueva de la Cañada, Spain
8
Instituto de Astrofísica de Andalucía-CSIC, Glorieta de la Astronomía s/n, 18 008 Granada, Spain
Key words: surveys / proper motions / Galaxy: structure / supergiants / stars: kinematics and dynamics / errata, addenda
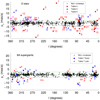
The wrong versions of Figs. 1 and 2 were published in the paper. The points corresponding to Table 6 in the top panels were missing and a single “dummy” unlabeled point was shown instead. The correct versions are given here.
 |
Fig. 1. Observed proper motion in Galactic latitude for O stars (top panel) and BA supergiants (bottom panel). Different colors and symbols are used to identify the runaway candidates in Tables 4–7, and the IDs in these tables are also shown. The dotted green lines represent the functions and 2σ deviations used to detect runaway candidates. The vertical scales are the same in both panels to facilitate comparison. |
 |
Fig. 2. Observed proper motion in Galactic longitude for O stars (top panel) and BA supergiants (bottom panel). Different colors and symbols are used to identify the runaway candidates in Tables 4–7, and the IDs in these tables are also shown. The dotted green lines represent the functions and 2σ deviations used to detect runaway candidates. The vertical scales are the same in both panels to facilitate comparison. |
© ESO 2019
All Figures
 |
Fig. 1. Observed proper motion in Galactic latitude for O stars (top panel) and BA supergiants (bottom panel). Different colors and symbols are used to identify the runaway candidates in Tables 4–7, and the IDs in these tables are also shown. The dotted green lines represent the functions and 2σ deviations used to detect runaway candidates. The vertical scales are the same in both panels to facilitate comparison. |
| In the text | |
 |
Fig. 2. Observed proper motion in Galactic longitude for O stars (top panel) and BA supergiants (bottom panel). Different colors and symbols are used to identify the runaway candidates in Tables 4–7, and the IDs in these tables are also shown. The dotted green lines represent the functions and 2σ deviations used to detect runaway candidates. The vertical scales are the same in both panels to facilitate comparison. |
| In the text | |
Current usage metrics show cumulative count of Article Views (full-text article views including HTML views, PDF and ePub downloads, according to the available data) and Abstracts Views on Vision4Press platform.
Data correspond to usage on the plateform after 2015. The current usage metrics is available 48-96 hours after online publication and is updated daily on week days.
Initial download of the metrics may take a while.


