Fig. A.1.
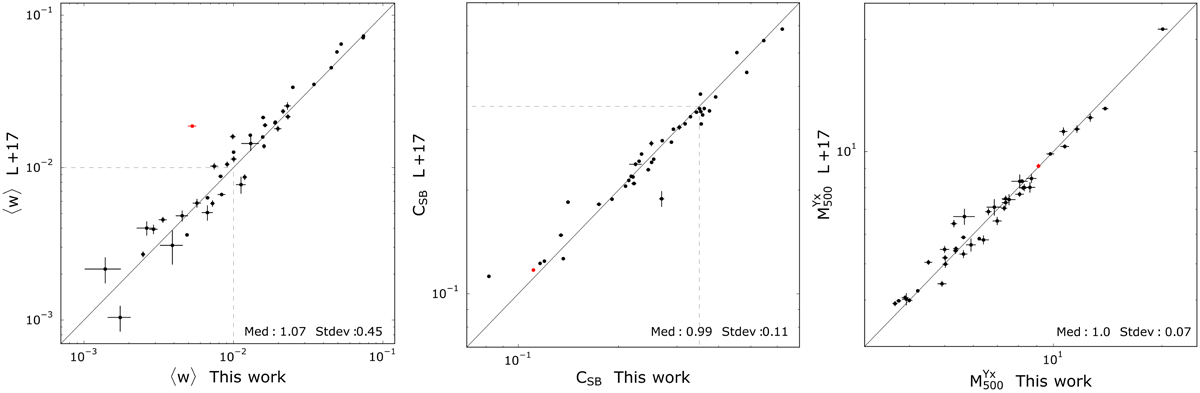
Left panel: comparison between the centroid shifts computed in this work and published in Lovisari et al. (2017) on the x and y axis, respectively. The red points highlight the outlier. The dotted lines indicate the threshold used to discriminate between disturbed and relaxed clusters. The solid line is the identity relation. The median and standard deviation were computed weighting by the errors and excluding the two outliers. Central panel: same as the left panel except that the comparison is done for the CSB. The dotted lines indicate the threshold used to discriminate between CC and non-CC clusters. Right panel: same as the left panel except that the comparison is done for the ![]() .
.
Current usage metrics show cumulative count of Article Views (full-text article views including HTML views, PDF and ePub downloads, according to the available data) and Abstracts Views on Vision4Press platform.
Data correspond to usage on the plateform after 2015. The current usage metrics is available 48-96 hours after online publication and is updated daily on week days.
Initial download of the metrics may take a while.