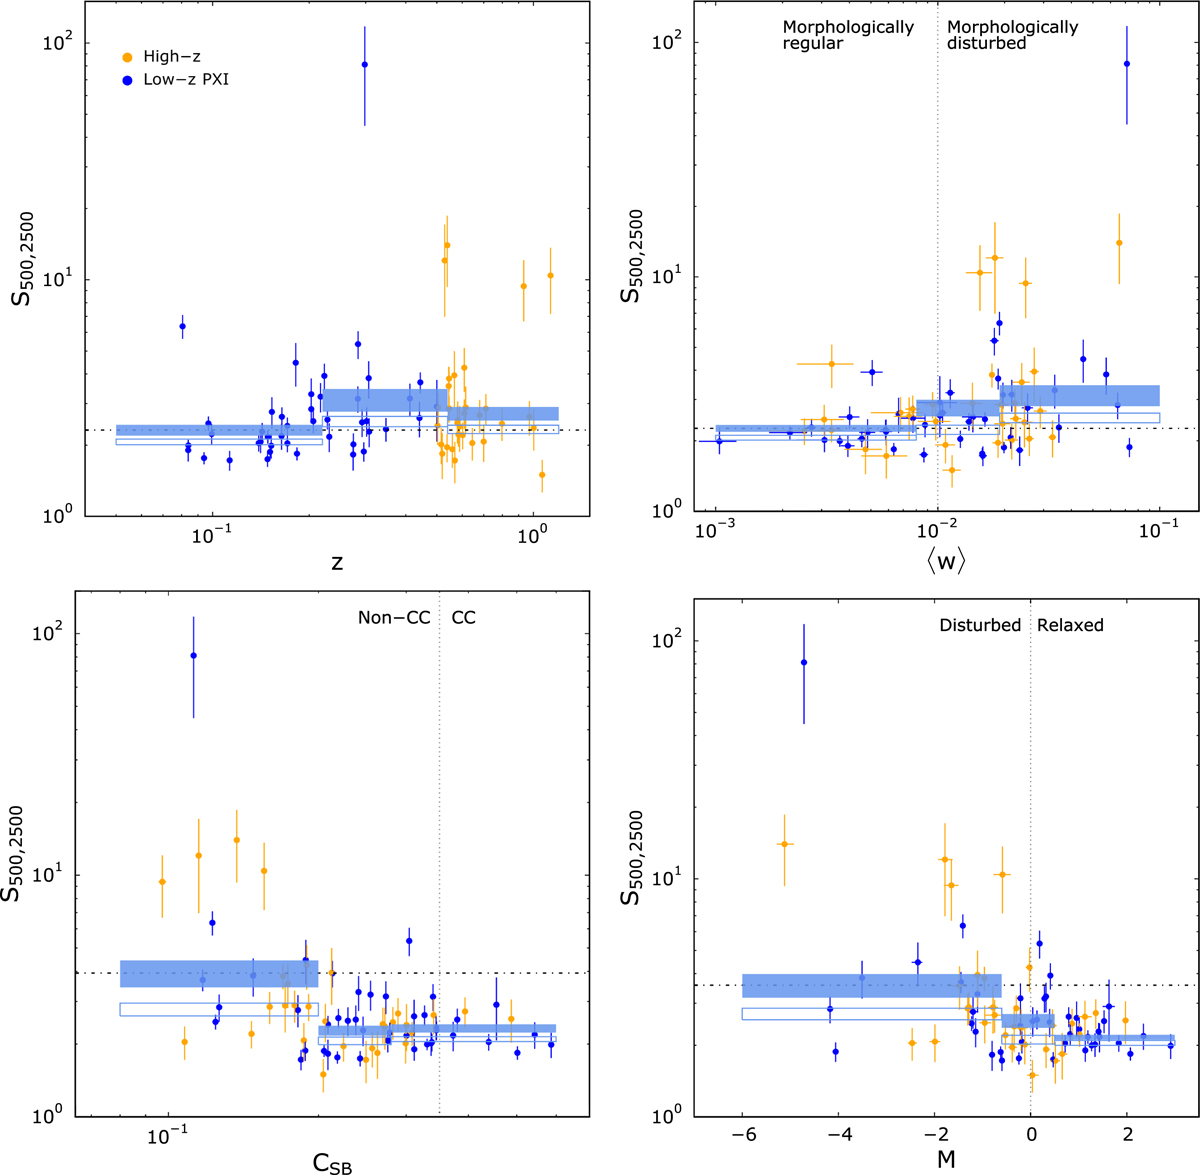
Fig. 6.

Top left panel: sparsity of the Low-z PXI and High-z samples as a function of redshift. The filled blue rectangles represent the mean sparsity weighted by the statistical errors and the intrinsic dispersion, estimated iteratively (see text), and its 1σ uncertainty. This is computed in three bins, defined to have approximately the same number of objects (see Table 1). The open blue rectangles represent the same quantity computed removing the outliers. We show as reference the median value of the first bin with the black dotted line. Top right panel: same but with the sparsity as a function of ⟨w⟩. Bottom left panel: same but with sparsity as a function of the CSB. Bottom right panel: same but with the sparsity as a function of M. The sparsity, i.e. the shape of the total mass profile, varies significantly with the dynamical state indicators. More disturbed clusters have higher sparsity i.e. they are less concentrated. The dependence on redshift is smaller than the dependence on the dynamical state.
Current usage metrics show cumulative count of Article Views (full-text article views including HTML views, PDF and ePub downloads, according to the available data) and Abstracts Views on Vision4Press platform.
Data correspond to usage on the plateform after 2015. The current usage metrics is available 48-96 hours after online publication and is updated daily on week days.
Initial download of the metrics may take a while.


