Fig. 5.
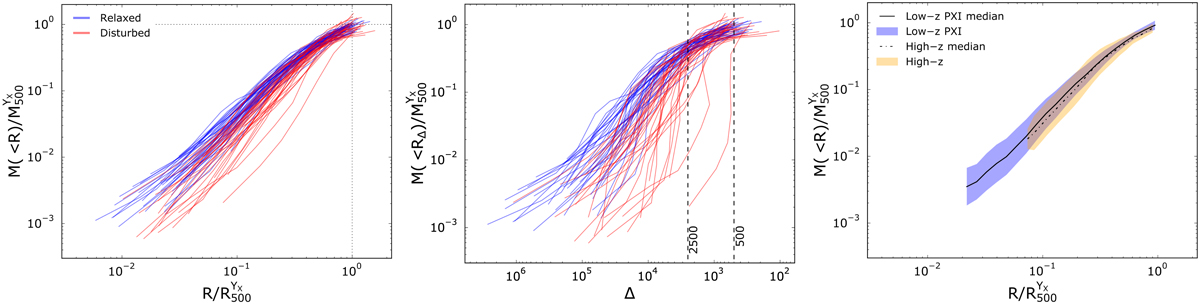
Scaled radial mass profiles extracted assuming hydrostatic equilibrium for the samples considered in this work. Left panel: radius and mass are scaled by ![]() and
and ![]() , respectively. Blue and red profiles represent relaxed and disturbed objects, respectively, according to the M parameter. Central panel: same as the left panel, except for the fact that we show the mass profile as a function of the density contrast, Δ. The vertical line Δ = 2500 is the overdensity used in this work to compute the sparsity described in Sect. 6. Right panel: comparison of the scaled mass profiles for the Low-z PXI and High-z samples. The solid line and dotted lines represent the median computed for the Low-z PXI and High-z samples, respectively. The gold and green shaded regions represent the 1σ dispersion of the Low-z PXI and High-z samples, respectively. Disturbed clusters have a shallower mass distribution, and present a larger dispersion than that of the most relaxed objects. On the other hand, the median HE mass profile depends mildly on redshift.
, respectively. Blue and red profiles represent relaxed and disturbed objects, respectively, according to the M parameter. Central panel: same as the left panel, except for the fact that we show the mass profile as a function of the density contrast, Δ. The vertical line Δ = 2500 is the overdensity used in this work to compute the sparsity described in Sect. 6. Right panel: comparison of the scaled mass profiles for the Low-z PXI and High-z samples. The solid line and dotted lines represent the median computed for the Low-z PXI and High-z samples, respectively. The gold and green shaded regions represent the 1σ dispersion of the Low-z PXI and High-z samples, respectively. Disturbed clusters have a shallower mass distribution, and present a larger dispersion than that of the most relaxed objects. On the other hand, the median HE mass profile depends mildly on redshift.
Current usage metrics show cumulative count of Article Views (full-text article views including HTML views, PDF and ePub downloads, according to the available data) and Abstracts Views on Vision4Press platform.
Data correspond to usage on the plateform after 2015. The current usage metrics is available 48-96 hours after online publication and is updated daily on week days.
Initial download of the metrics may take a while.