Fig. 4.
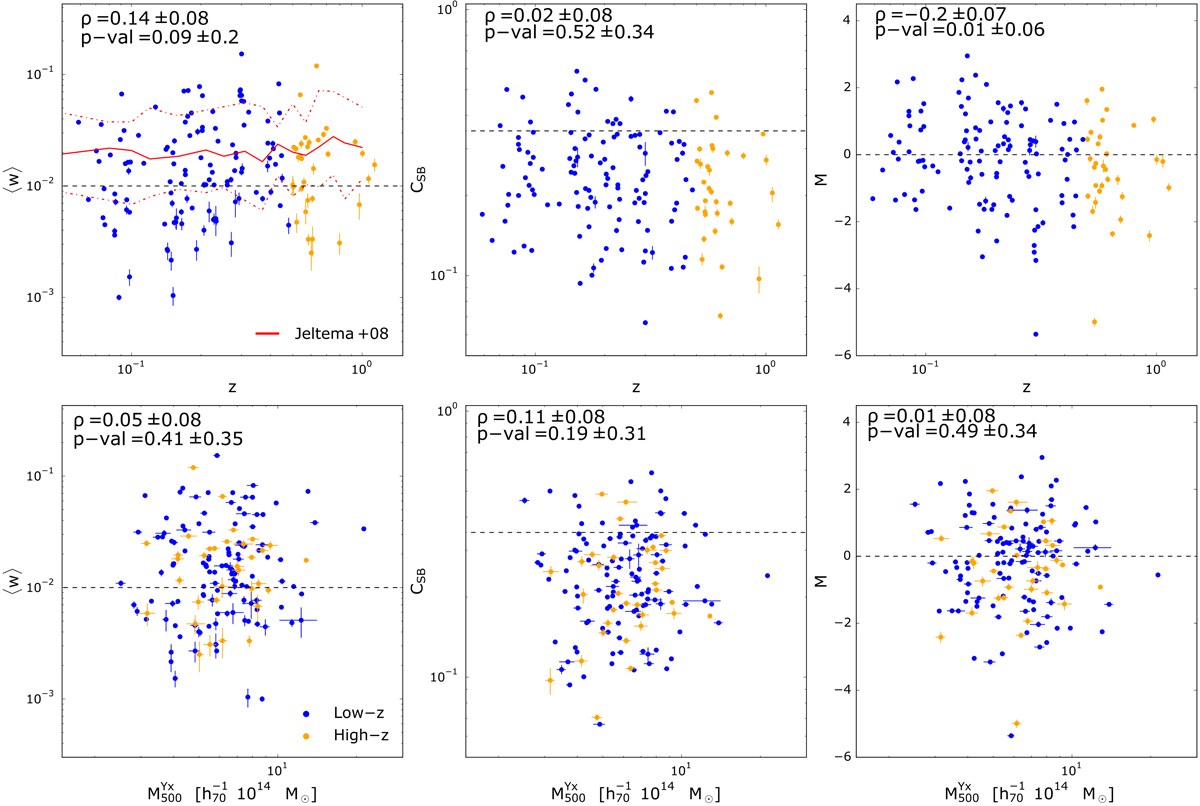
Morphological parameters vs. redshift (top panel) and mass (bottom panel) of all the clusters used in this work. High-z and Low-z sample clusters are colour-coded in blue and orange, respectively, following the sample colour code of Fig. 3. Left panels: centroid shift, ⟨w⟩. The solid red line is the mean ⟨w⟩ derived by Jeltema et al. (2008) from numerical simulations. The dotted lines correspond to the ±68% dispersion, Middle panel: concentration, CSB. Right panel: M parameter. In each panel, the horizontal dotted line identifies the corresponding threshold, as defined in Fig. 3. The symbols ρ and p-value correspond to the Spearman’s rank correlation factor and the corresponding null hypothesis p-value, respectively. Errors on these quantities are computed through 1000 bootstrap resampling. The figure corroborates the lack of evolution with redshift of ⟨w⟩ and CSB shown in Fig. 3. However, there is a mild but significant evolution of the combined parameter M. There is no dependence on mass of the morphological parameters.
Current usage metrics show cumulative count of Article Views (full-text article views including HTML views, PDF and ePub downloads, according to the available data) and Abstracts Views on Vision4Press platform.
Data correspond to usage on the plateform after 2015. The current usage metrics is available 48-96 hours after online publication and is updated daily on week days.
Initial download of the metrics may take a while.