Fig. 3.
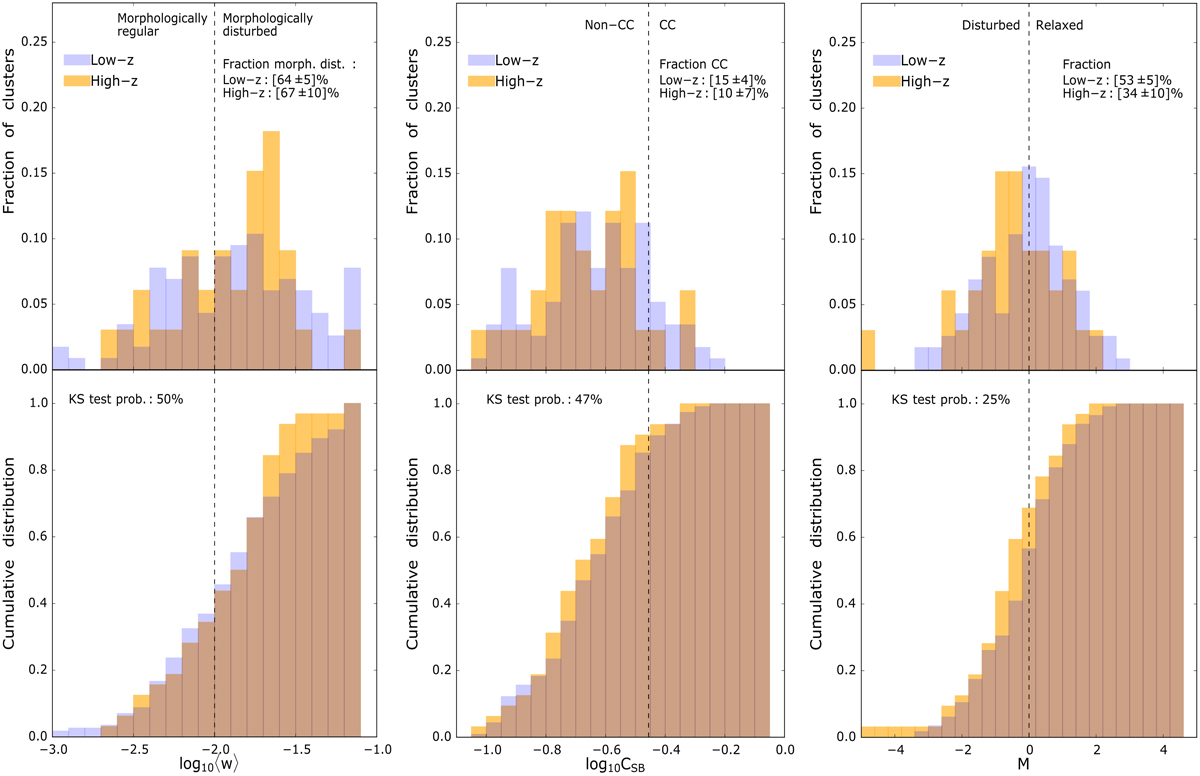
From left to right, normalised histogram (top panels) and cumulative distributions (bottom panels) of the centroid shift, ⟨w⟩, the concentration CSB, and the M parameter (Eq. (7)). The CSB of the High-z sample has been k-corrected as described in Sect. 4.2. The Low-z and High-z distributions are shown in blue and orange, respectively. The vertical dotted line represents the threshold value for each parameter. Left panel: ⟨w⟩=0.01 threshold, separating morphologically regular and disturbed clusters. Central panels: CSB = 0.35 threshold, between cool core (CC) and non-CC objects. Right panels: M = 0 threshold, between disturbed and relaxed objects. The corresponding fraction above each threshold is given in the top right of each figure. In the bottom panels, we report the p-value of the null hypothesis (i.e. that the two distributions are drawn from the same distribution) from the Kolmogorov–Smirnov (KS) test. The distribution of morphologically disturbed and CC objects, based on the parameter ⟨w⟩ and CSB, are not statistically different in the High-z and Low-z samples. However, the combination of the two parameters, M, indicates that the fraction of disturbed objects is significantly higher in the High-z sample.
Current usage metrics show cumulative count of Article Views (full-text article views including HTML views, PDF and ePub downloads, according to the available data) and Abstracts Views on Vision4Press platform.
Data correspond to usage on the plateform after 2015. The current usage metrics is available 48-96 hours after online publication and is updated daily on week days.
Initial download of the metrics may take a while.