Open Access
Fig. 2.
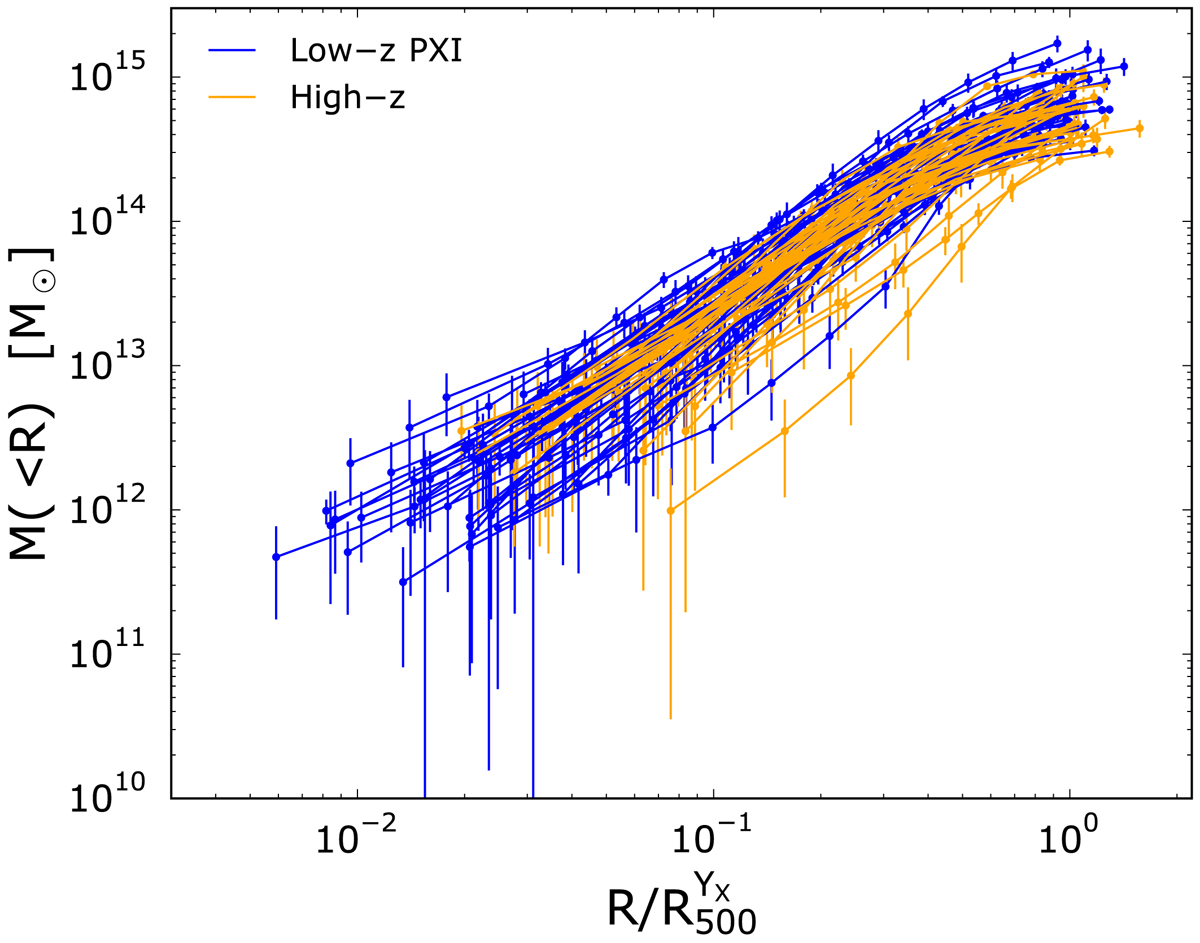
Integrated mass profiles as a function of scaled radius, estimated from the hydrostatic equilibrium equation, for all clusters considered in this work. The Low-z PXI and High-z samples are plotted in blue and red, respectively.
Current usage metrics show cumulative count of Article Views (full-text article views including HTML views, PDF and ePub downloads, according to the available data) and Abstracts Views on Vision4Press platform.
Data correspond to usage on the plateform after 2015. The current usage metrics is available 48-96 hours after online publication and is updated daily on week days.
Initial download of the metrics may take a while.