Fig. 1.
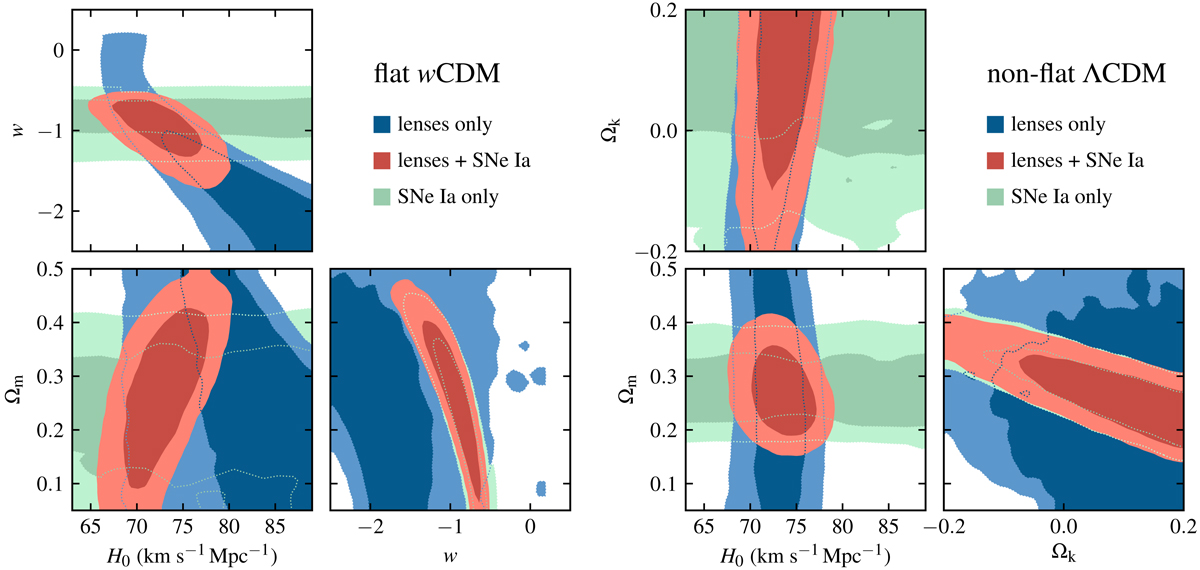
Contour plots with 68% and 95% confidence regions for H0, Ωm, and w in a flat wCDM cosmology (left-hand side), and for H0, Ωm, and Ωk in a non-flat ΛCDM cosmology (right-hand side). Contours based on quasar time delays and SNe Ia (JLA compilation) alone are shown in blue and green, respectively, while those using the inverse distance ladder with both probes combined are overplotted in red.
Current usage metrics show cumulative count of Article Views (full-text article views including HTML views, PDF and ePub downloads, according to the available data) and Abstracts Views on Vision4Press platform.
Data correspond to usage on the plateform after 2015. The current usage metrics is available 48-96 hours after online publication and is updated daily on week days.
Initial download of the metrics may take a while.