| Issue |
A&A
Volume 628, August 2019
|
|
|---|---|---|
| Article Number | A102 | |
| Number of page(s) | 7 | |
| Section | Stellar atmospheres | |
| DOI | https://doi.org/10.1051/0004-6361/201935946 | |
| Published online | 13 August 2019 | |
Carbon-rich (DQ) white dwarfs in the Sloan Digital Sky Survey★
1
Institut für Theoretische Physik und Astrophysik, Universität Kiel,
24098 Kiel, Germany
e-mail: koester@astrophysik.uni-kiel.de
2
Instituto de Fisica, Universidade Federal do Rio Grande do Sul,
91501-900
Porto-Alegre,
RS, Brazil
Received:
24
May
2019
Accepted:
26
June
2019
Context. Among the spectroscopically identified white dwarfs, a fraction smaller than 2% have spectra dominated by carbon lines, mainly molecular C2, but also a smaller group dominated by C I and C II lines. These are together called DQ white dwarfs.
Aims. We want to derive atmospheric parameters Teff, log g, and carbon abundances for a large sample of these stars and discuss implications for their spectral evolution.
Methods. Sloan Digital Sky Survey spectra and ugriz photometry were used, together with Gaia Data Release 2 parallaxes and G band photometry. These were fitted to synthetic spectra and theoretical photometry derived from model atmospheres.
Results. We found that the DQ hotter than Teff ~ 10 000 K have masses ~ 0.4 M⊙ larger than the classical DQ, which have masses typical for the majority of white dwarfs (~ 0.6 M⊙). We found some evidence that the peculiar DQ below 10 000 K also have significantly larger masses and may thus be the descendants of the hot and warm DQ above 10 000 K. A significant fraction of the hotter objects with Teff > 14 500 K have atmospheres dominated by carbon.
Key words: stars: atmospheres / white dwarfs / stars: carbon
Full Tables 1 and 2 are only available at the CDS via anonymous ftp to cdsarc.u-strasbg.fr (130.79.128.5) or via http://cdsarc.u-strasbg.fr/viz-bin/qcat?J/A+A/628/A102
© ESO 2019
1 Introduction
White dwarfs of spectral type DQ are a subclass of hydrogen-poor objects, meaning that hydrogen is not the dominant element as in the vast majority of white dwarfs. Historically the first objects known (henceforth simply called DQ) are characterized by Swan bands of the C2 molecule in the optical region. Later objects with strong C I resonance lines in the UV were added to this class (Sion et al. 1983), even if they do not show any features in the optical range. Systematic analyses of larger samples are carried out in Dufour et al. (2005) and Koester & Knist (2006). Contrary to the numerous metal-polluted hydrogen- and helium-rich white dwarfs, where the metals are believed to be accreted from the debris of disintegrating members of a former planetary system, the carbon in the DQ (at least those DQ below 10 000 K) is a result of dredge-up by an extending convection zone in the upper helium layer (Koester et al. 1982; Pelletier et al. 1986).
With the discovery of thousands of new white dwarfs thanks to the Sloan Digital Sky Survey (SDSS, York et al. 2000; Abolfathi et al. 2018) a number of hotter objects with carbon features were found (Liebert et al. 2003; Dufour et al. 2008). The latter analysis surprisingly concluded that the group of hot objects showing mostly C II in the range of effective temperatures from 18 000 to 24 000 K was in fact dominated by carbon in their atmospheres, with only occasional traces of hydrogen, helium, or oxygen. Several members of this group show magnetic fields, light variations, and unusually high masses. In spite of many suggestions, the evolutionary status of these objects is not fully understood (Fortier & Dufour 2015).
Between the classical DQ and the new “hot DQ” (hDQ here) class several objects with spectra dominated by C I lines in the optical range are now termed “warm DQ” (wDQ here) (Dufour et al. 2013; Fortier & Dufour 2015). These objects are believed to be helium dominated, but with large carbon contributions of log(N(C)/N(He)) (abbreviated as [C/He] henceforth) about −3 to −2.
Several authors have found that the carbon abundances, when shown as a function of Teff, have a clear tendency from higher to lower values with decreasing temperature, and that a separate second sequence exist with higher abundances (see, e.g., Kepler et al. 2016). The upper sequence was also suggested to have higher masses, although the data were very limited.
The surface gravities and masses are very difficult to determine spectroscopically and only a few were known until recently. The situation was much improved when the Gaia Data Release 2 (DR2) parallaxes for many of these objects were published (Gaia Collaboration 2018). Atmospheric parameters for a large sample of white dwarfs with Gaia parallaxes and SDSS spectra, which also included many DQ white dwarfs, werestudied by Gentile Fusillo et al. (2019). The first application of such a sample, which additionally obtained abundances, was Coutu et al. (2018), who very clearly show two separate sequences in the mass distribution as well as the abundance versus Teff distribution. All objects up to the highest Teff of ~ 15 000 K in their results have helium-dominated atmospheres with [C/He] < −1.5. The hottest object is SDSSJ1448+0519 (we use this shorthand notation, the complete official SDSS name can be found in Table 1, if necessary via the p-m-f designation of the spectra), identified with the parameters Teff = 15 473 K, log g = 8.94, [C/He] = − 1.70. This object is also in our sample (described in Sect. 2). We calculated a model with these parameters. The model (Fig. 1) shows strong He lines at 4472, 5877, and 6679 Å (all these regions are not included in the figurein Coutu et al. 2018), which are completely absent in the observed spectrum. With our analysis we find instead that this object has a carbon-dominated atmosphere with an upper limit on the helium abundance of [He/C] < −0.30. This raises the question of the nature of the transition between hot and normal DQ, roughly in the temperature range 10 000–18 000 K. Since the helium lines become invisible below 12 000 K, or even higher in low signal-to-noise ratio (S/N) spectra, this is a difficult question, which is the major topic of this study. In addition we will present some resultsfor a fairly large sample of classical cool DQ and a few hot DQ, which generally agree with previous findings.
Observed data for the DQ + carbon star sample.
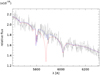 |
Fig. 1 SDSSJ1448+0519 (gray, continuous) compared with our models using the Coutu et al. (2018) parameters (Teff, log g,[C/He] = 15776, 8.851, −1.70, red dotted) and our own best fit (15966,8.943,0.300, blue dashed). Full SDSS names are given in Table 1. |
2 Observations and choice of sample
The originalsample in our study (572 stars) included all stars classified as DQ from the 34 973 white dwarfs in Kleinman et al. (2013); Kepler et al. (2015, 2016, 2019), even if the classification was uncertain. Therefore the DQ represent at most 1.6% of the classified white dwarfs from SDSS, and 9% of the objects not dominated by hydrogen (non-DA).
From these we selected the spectra with highest S/N obtained by SDSS up to DR14 for stars that have Gaia DR2 parallaxes, necessary to estimate the Teff, log g, and mass. We further eliminated some wrong or uncertain identifications, and objects with low S/N or very weak features. We did not aim at complete samples, but for a sample with accurate parameter determinations. Most spectra have S∕N > 10, but we included some with lower values if the features were strong and easily recognized. Also eliminated were objects with Gaia parallax uncertainties larger than 25%. We were then left with 304 stars, all showing clear carbon features of Swan bands of the C2 molecules, or lines from C I and/or C II. These stars are listed in Table 1, together with some of the observed data.
When we started the analysis, 29 objects indicated very low surface gravities, at the lowest gravities of our model grids, but still without a reasonable fit. Visual inspection revealed very narrow bands and lines, in particular Hα. These objects are very similar to those described in Whitehouse et al. (2018), and we classify them as dwarf carbon stars (dC); they will not be discussed further in this study. Another 21 objects show Swan bands, but of a peculiar, rounded shape and usually blue shifted. This shift is not really understood yet, but the discussions center on pressure shifts of the Swan bands in high density helium (Hall & Maxwell 2008; Kowalski 2010). Since our models do not include this effect, we cannot determine accurate parameters for these peculiar DQ (DQpec), but will discuss their relevance for the spectral evolution of the DQ in Sect. 6. This leaves 254 objects for the analysis. Figure 2 shows examples for all types discussed here: DQ, warm DQ, hot DQ, peculiar DQ, and dwarf carbon stars dC.
3 Theoretical models
We calculated theoretical atmosphere models using basically the methods described in Koester (2010). However, the code was completely rewritten, using the more modern FORTRAN95 language, which supports a much stronger modularization of the programs. We updated the equation of state (EOS) to use many more molecules, and include non-ideal effects for neutral and charged interactions consistently in the EOS, and secondary quantities as adiabatic derivatives, heat capacity, and the adiabatic gradient. The absorption coefficients include more negative ions than in previous versions of the code, and many photoionization cross sections.
For the current DQ models 12 molecular species of H and C were included, with 300 C2 bands, 211 cross sections from C I to C IV, and 713 spectral lines. We calculated two grids, the cool one with 5000 K ≤ Teff ≤ 15 000 K, step 250 K, 7.0 ≤ log g ≤ 9.5 dex, step 0.25, − 9.5 ≤ [C/He] ≤ −2.0, step 0.5, altogether 7216 models. The second, hot grid had 9000 K ≤ Teff ≤ 20 000 K, step 250 K, and 20 000 K ≤ Teff ≤ 30 000 K, step 1000 K, 7.0 ≤ log g ≤ 9.5 dex, step 0.25, − 4.0 ≤ [C/He] ≤ +4.0, step 0.5, resulting in 10 285 models. The total model grids thus comprise 17 501 models.
From the synthetic spectra we calculated theoretical photometry for the SDSS ugriz filters and the Gaia G filter by convolving with the filter bandpasses and applying appropriate zeropoints. We also converted these theoretical magnitudes to absolute magnitudes by using the Montreal mass-radius-relation1, except for log g > 9.00 where we used the zero-temperature relation for carbon from Hamada & Salpeter (1961). Since all objects in our sample have Gaia parallaxes, we can transform the distance into a distance modulus m − M = 5 log(distance pc-1) − 5. The advantage isthat the distance is expressed on a magnitude scale and can be used in the fitting in the same way as the other six magnitudes (ugrizG).
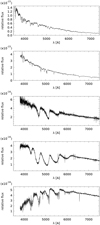 |
Fig. 2 Examples for the different carbon star types. From top to bottom: (i) a hot DQ, hDQ (SDSSJ1104+2035), (ii) a warm DQ, wDQ (SDSSJ1728+5558), (iii) a classical DQ (SDSSJ1356−0009), (iv) a DQpec (SDSSJ2232−0744), and (v) a dwarf carbon star, dC (SDSSJ1127−0212). We note theextremely sharp band heads and Balmer lines. |
4 Analysis of photometric and spectroscopic data
The new parallaxes provide a very strong constraint on the radius, or in our fitting method on the distance modulus m − M. With observed magnitude m and M from our theoretical grid, this is an equally strong constraint of the surface gravity log g. As this depends only on the average level of the observed photometry and not on the shape of the energy distribution, this is a much more robustdetermination than the usual spectroscopic method using spectral line profiles.
Our tests indicated that the most successful procedure is an iteration between spectroscopic and photometric fitting. For the cool and warm DQ (Teff < 18 000 K) we used the photometry with fixed [C/He] to obtain Teff and log g; the spectroscopic fitting is used with fixed Teff and log g and determines a new value for [C/He]. The iteration stops when the latter value does not change within the uncertainty. As a final consistency check we carried out a last spectroscopy fitting with log g and [C/He] fixed, but Teff freely variable. If this spectroscopic Teff agreed with the photometric one, the procedure was stopped.
For the hot DQ (hDQ) we used the photometry only for log g and spectroscopy for Teff and [C/He]. This worked better in the hotter temperature range, since the dependence of the photometry on temperature gets smaller in the optical Raleigh-Jeans range. The absence of He lines in the hot DQ indicates a [C/He] > 1. Since the spectra do not change significantly with even higher ratios, we use a fixed [C/He] = 2 to obtain Teff from spectroscopy and log g from photometry.
When using photometry for more distant objects, the interstellar reddening is always a concern. Fortunately for our objects the maximum reddening through the galactic disk, obtained from the SDSS database, is always small, mostly in the range 0.04 ≤ E(B–V) ≤ 0.05, because the SDSS observations are by design mostly in a direction perpendicular to the plane of the Galaxy. We have taken a fraction of this value depending on the estimated distance, calculated as in Gentile Fusillo et al. (2019).
5 Results
The objects showing Swan bands were fitted with the low temperature grid, the others with the hot grid.
5.1 Classical DQ
Table 2 presents the results for the atmospheric parameters of the 221 DQ white dwarfs in the final sample. The range of temperatures and abundances agrees with previous studies of large samples like Dufour et al. (2005) and Koester & Knist (2006). With the exception of a figure in Coutu et al. (2018), however, this is the first time that large numbers of surface gravities (or masses) are presented for these objects. There is one cool DQ identified in Coutu et al. (2018), which is also in our sample: SDSSJ1355+3636, with Teff = 8040 K, log g = 7.91, [C/He] = − 5.04. While the atmospheric parameters agree quite well with our solution in Table 2, the [C/He] ratio we obtain is ~ 0.7 dex higher.
The gravities of the cool DQ are comparable to those of other cool, helium-dominated objects, as is demonstrated in Table 3. The cool white dwarfs with traces of metals (DZ), the hotter ones dominated by helium lines (DB), and those showing no features at all (DC) were drawn from the samples in Kleinman et al. (2013), and Kepler et al. (2015, 2016, 2019), but the parameters were redetermined for this study. A significant fraction of DB white dwarfs is known to contain traces of hydrogen (spectral type DBA), and Bergeron et al. (2019) have argued that using pure helium atmospheresfor cool DC can lead to artificially higher masses. We have used different grids with [H/He] between − 3.0 and − 6.0 for the fitting. The results in the table were obtained with − 4.0, which we have preferred because the resulting average masses are almost constant from 15 000 K down to 6000 K. The DZ were fitted with [H/He] = − 4.5, but in this case the effect of the hydrogen is not important, since the free electrons come from the metals.
The average surface gravities between the three types of helium-rich objects are slightly different, with the DQ having the smallest values and DZ and DC about 0.06 and 0.10 dex larger, respectively. Considering the extreme physical conditions in cool, helium-rich atmospheres, the uncertainties on the amount of hydrogen present, and the uncertain reddening, we will not speculate on possible reasons for this difference but refer further discussion to future work.
Fit results for the classical DQ with Swan bands.
Comparison of average surface gravities for different types of helium-rich, cool white dwarfs.
5.2 Warm DQ (wDQ)
These objects are characterized by C I lines and occasionally at the cool end with weak C2 bands. Unfortunately there appear to be severe problems with the atomic data of these lines. Our main source was the Vienna Atomic Line Database (VALD, Kupka et al. 1999, 2000; Piskunov et al. 1995)2. Spectral fits with theoretical models agree reasonably in the red part of the spectrum, λ > 4600Å. In the blue part, however, many lines are predicted to be much stronger than they appear in the observed spectrum. In the National Institute for Standards and Technology (NIST, Kramida et al. 2018) database3 are only two lines in this range with log gf values published, none with class A quality. The sources are Haris & Kramida (2017) and Luo & Pradhan (1989). In a literature search we found only very little data, but some indication that the VALD data could be quite wrong. Victor & Escalante (1988) give log gf values of − 2.143 for the 4270.221 Å line, whereas the VALD value is − 1.637, and NIST has − 1.5. For the 4892.019 Å line the same source has − 3.602, compared to − 1.541 in VALD. We have replaced those and a few other lines from the same source, and arbitrarily scaled the values for several strong lines in the blue region to be compatible with the fit to the red part. This can be considered as an empirical gf determination; the argument for this procedure is to make the theoretical photometry more reliable. For the spectral fitting we used only the red part of the spectrum between 4600 and 8000 Å.
As we determine Teff and log g through the photometry, the results do not depend much on the [C/He] ratio. On the other hand, if we keep Teff and log g fixed when analyzing the spectra, the only remaining variable is the abundance ratio. The carbon is diluted in the helium, weakening the lines and leading to the abundance determination. As long as [C/He] ≤ −1.0, this works well. However, at higher ratios the influence of helium weakens and the errors get much larger, up to 0.73 dex. In two cases (SDSSJ1448+0519, SDSSJ1728+5558) this led to best fit models, which predicted strong He lines, that are not observed. We have determined individual lower limits of [C/He] and continued the iteration for Teff and log g with these limits fixed. These objects are indicated with asterisks in Fig. 3
The results of this analysis are shown in Table 4 and Fig. 3. Apart from SDSSJ1448+0519 shown in Fig. 1, there is one other warm DQ in our sample also identified in Coutu et al. (2018), SDSSJ1215+4700 with Teff = 12349 K, log g = 8.80, [C/He] = − 2.27. Our temperature is 1600 K higher, the other parameters agree reasonably well.
Many of the wDQ show Balmer lines of hydrogen. We therefore calculated the grid with trace hydrogen of [H/He] = − 4.5, a typical value for DBs. Some objects, however, show much stronger Hα than in the best fitting model, one of the strongest being SDSSJ1622+3004. We determined the H abundance as [H/He ] = − 2.00 and verified that this did not change the model spectrum except close to the Balmer lines. The fit results for the wDQ are therefore not affected. In a subsequent paper we will study the extent of the convection zones beyond the bottom of the atmospheres(all models in our grids are convective down to the bottom of the model) with envelope models. We will then also determine accurate hydrogen abundances to determine the total masses of H and He in the convection zone. This could help to understand the origin and evolution of DQ stars.
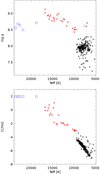 |
Fig. 3 Analysis results for the complete DQ sample. Top panel: log g as a function of Teff for DQ (black crosses), wDQ (red xses), and hDQ (blue squares). The large red circle is the average result for peculiar DQ as explained in Sect. 6. Bottom panel: [C/He] abundance ratios, with the same symbols as in the top panel, except for the two red asterisks, which are warm DQ with individually determined lower limit on [C/He]. The [C/He] for the hot DQ were held fixed and are typical lower limits. |
5.3 Hot DQ (hDQ)
We have arbitrarily identified the objects with Teff > 18 000 K as hot DQ, since there is a continuous transition in the strength of C II lines (e.g., 4621, 5146, 5891, 5893, 6153, 6463, 6579, 6584 Å) compared to C I lines. The complete absence of He lines in all hDQ translates to lower limits of [C/He] = 1.0–2.0, depending on the S/N of the spectrum. Since the fit results do not change with further increase of this ratio, we have used a fixedvalue of [C/He] = 2.0 for the fit. The results of the analysis are collected in Table 5.
6 Discussion and conclusions
Detailed results of the analysis are presented in Tables 2, 4, and 5, but the main result is seen in Fig. 3. In the bottom panel, showing the abundances as a function of temperature, the classical DQ form a very well-defined dominant sequence from 9000 K, [C/He] = − 4.5 down to 5000 K, [C/He] = − 7.0. This agrees with previous findings in the literature (e.g., Pelletier et al. 1986; Dufour et al. 2005; Koester & Knist 2006). A number of objects are located in a range about 1.0–1.5 dex in abundance above this sequence, and there may be another sequence at the upper limit of this range, although the evidence is not too strong. Going to higher Teff, the upper sequence continues with the warm DQ up to 17 000 K, [C/He] around 0.0. This is surprising since the warm DQ have been considered as helium dominated, like the classical DQ (e.g., Coutu et al. 2018). Amongst the hottest group is SDSSJ1448+0519 mentioned in the Introduction and shown in Fig. 1, which clearly cannot have as much helium as found in Coutu et al. (2018). This group seems to be a transition to the hot DQ, which are clearly carbon dominated, although the helium content cannot be determined from the available spectra; the squares in the figure are approximate lower limits for carbon.
Taking this bottom panel at face value, this would argue for a continuous transition of very carbon-rich spectra to ever lower C abundances with decreasing temperature. It is tempting to identify this with some convection zones changing in depth with changes of Teff but there are contradictions to our current understanding of He layer convection, which shows a maximum depth around 10 000 K (Fontaine & Brassard 2005).
Even more puzzling is the top panel of Fig. 3. While the cool DQ seem to have normal surface gravities around 8.0 and thus normal masses, this is clearly not true for warm and hot DQ. The current assumption was that the warm DQ have about the same masses as the cool ones, but we find instead a sequence increasing from log g ≥ 8.5–9.1 with Teff from 10 000 to 18 000 K, whereas the hot DQ have only log g ~ 8.5–8.7. The high log g values for the range 13 000–17 000 K are the most puzzling result of our study. Considering the problems with the atomic data for C I discussed above, one might question the validity of our analysis. As a test we have used the spectra also for the temperature determination and the photometry only for the surface gravity, as in the hot DQ. There are small differences in the parameters obtained, but the general picture with the high log g around 15 000 K remains.
We note that the log g determination via photometry and parallax is very robust: assuming that the correct temperature for a 15 000 K determination were 13 000 K, that is, an error of 2000 K, the surface gravity would only go down from 9.0 to 8.83, still significantly higher than at higher and lower Teff. One might argue that the mass-radius relation used – for He atmosphere white dwarfs – is not appropriate, when [C/He] ~ 0.0. However, at 15 000 K, log g = 9.0, the radius changes very little between helium atmosphere (0.00571 R⊙), hydrogen atmosphere (0.00573 R⊙), or even the zero-temperature Hamada–Salpeter radius (0.00570 R⊙ for carbon, Hamada & Salpeter (1961)).
The problems with the C I atomic data, some differences between our results and Coutu et al. (2018), and the unexpected surface gravities for the warm DQ indicate that improvements to the model calculations may still be necessary. In spite of these remaining uncertainties it is clear that there are two separate groups of carbon white dwarfs. The classical DQ can be understood as dredge-up of the helium convection zone from the tail of the C/He transition layer (Koester et al. 1982; Pelletier et al. 1986); the decrease of the carbon abundance with decreasing temperature is a result of the depth of the convection zone decreasing again below the maximum near 10 000 K, as predicted by model calculations (Fontaine & Brassard 2005). If the high masses of warm and hot DQ (which together may form the second group) are confirmed, they cannot be the progenitors of the cool DQ. There are only two cool DQ with log g > 8.50. This number seems too small because of the slowing down of the evolution at low temperatures; a final conclusion, however, would need a population synthesis taking into account the accurate evolution, including crystallization and Debye cooling, as well as the observational detection biases in the SDSS.
Becauseour models do not adequately describe the spectra of the peculiar DQ, we cannot determine reliable temperatures for them. The presence of strong Swan bands indicates a range from 10 000–5000 K. We have therefore used a fixed temperature of 7500 K, [C/He] = − 5.00, and used the photometry to estimate the surface gravities. If the real Teff is higher, the real log g will be higher than our result, and vice versa for lower real Teff. This indicates that the average result could be a reasonable indicator of the typical gravities of the DQpec. This average for the 21 DQpec in the sample is 8.625, with a distribution width of 0.298. This value is shown as a large circle in Fig. 3, confirming the possible identification of the DQpec as descendants of the hot and warm classes. The position close to the two cool DQ with higher gravity suggests that the two objects may in fact belong to the DQpec class.
The high gravity also supports the idea that the unusual shape and shift of the molecular Swan bands is indeed due to the high He densities in these massive white dwarfs (Kowalski 2010). We do not yet know the C/He ratio for these stars, but a comparison of band strengths with those in normal DQ indicates helium-dominated atmospheres with slightly larger [C/He] values as in the DQ.
Another open question is how the hot DBs with small traces of carbon visible only in the ultraviolet (Fontaine & Brassard 2005; Koester et al. 2014a) are related to the two groups. Except for one object in the latter study, accretion as the origin of thecarbon is considered highly unlikely, either because no other metals are observed, or because the inferred C/Si ratio in the accreted matter is extremely large. This is quite different from what is observed in accreting DAZ and DBZ in the same temperature range (Koester et al. 2014b), leaving dredge-up of the carbon as a plausible explanation. Since they do not share very high masses with the hot DQ, they could be related to the classical cool DQ.
In a subsequent paper we will study the evolution of the convection zones in mixed H/He/C envelopes and the total amount of hydrogen and helium present in them. Hopefully that can shed some light on the origin and evolution of these puzzling stars.
Fit results for the warm DQ (wDQ).
Fitresults for the hot DQ (hDQ) with Teff > 18 000 K.
Acknowledgement
We thank Patrick Dufour and Simon Coutu for sharing with us a poster presented at the EUROWD-21 workshop in Austin 2018. We have used their results in the belief that they are public. Only very recently we realized that this paper is not available in the public archive of the conference. We acknowledge that Coutu et al. (2018) was the first paper to determine carbon abundances for DQ using Gaia data. Our current study was motivated by their results. This work was financed in part by the Coordenação de Aperfeiçoamento de Pessoal de Nível Superior – Brasil (CAPES) – Finance Code 001, Conselho Nacional de Desenvolvimento Científico e Tecnológico - Brasil (CNPq), and Fundação de Amparo à Pesquisa do Rio Grande do Sul (FAPERGS) – Brasil. This research has made use of NASA’s Astrophysics Data System Bibliographic Services, the SIMBAD database, operated at CDS, Strasbourg, France, the NIST and VALD atomic databases, and public data from the Sloan Digital Sky Survey and the Gaia Mission.
References
- Abolfathi, B., Aguado, D. S., Aguilar, G., et al. 2018, ApJS, 235, 42 [NASA ADS] [CrossRef] [Google Scholar]
- Bergeron, P., Dufour, P., Fontaine, G., et al. 2019, ApJ, 876, 67 [NASA ADS] [CrossRef] [Google Scholar]
- Coutu, S., Dufour, P., Bergeron, P., Blouin, S., & Loranger, E. 2018, Poster EUROWD 21, Austin [Google Scholar]
- Dufour, P., Bergeron, P., & Fontaine, G. 2005, ApJ, 627, 404 [NASA ADS] [CrossRef] [Google Scholar]
- Dufour, P., Fontaine, G., Liebert, J., Schmidt, G. D., & Behara, N. 2008, ApJ, 683, 978 [NASA ADS] [CrossRef] [Google Scholar]
- Dufour, P., Vornanen, T., Bergeron, P., & Fontaine, A. B. 2013, in 18th European White Dwarf Workshop., ASP Conf. Ser., 469 167 [NASA ADS] [Google Scholar]
- Fontaine, G., & Brassard, P. 2005, in 14th European Workshop on White Dwarfs, eds. D. Koester & S. Moehler, ASP. Conf. Ser., 334, 49 [NASA ADS] [Google Scholar]
- Fortier, A., & Dufour, P. 2015, in 19th European Workshop on White Dwarfs, eds. P. Dufour, P. Bergeron, & G. Fontaine, ASP Conf. Ser., 493,41 [NASA ADS] [Google Scholar]
- Gaia Collaboration (Brown, A. G. A., et al.) 2018, A&A, 616, A1 [NASA ADS] [CrossRef] [EDP Sciences] [Google Scholar]
- Gentile Fusillo, N. P., Tremblay, P.-E., Gänsicke, B. T., et al. 2019, MNRAS, 482, 4570 [NASA ADS] [CrossRef] [Google Scholar]
- Hall, P. B., & Maxwell, A. J. 2008, ApJ, 678, 1292 [NASA ADS] [CrossRef] [Google Scholar]
- Hamada, T., & Salpeter, E. E. 1961, ApJ, 134, 683 [NASA ADS] [CrossRef] [Google Scholar]
- Haris, K., & Kramida, A. 2017, ApJS, 233, 16 [NASA ADS] [CrossRef] [Google Scholar]
- Kepler, S. O., Pelisoli, I., Koester, D., et al. 2015, MNRAS, 446, 4078 [NASA ADS] [CrossRef] [Google Scholar]
- Kepler, S. O., Pelisoli, I., Koester, D., et al. 2016, MNRAS, 455, 3413 [NASA ADS] [CrossRef] [Google Scholar]
- Kepler, S. O., Pelisoli, I., Koester, D., et al. 2019, MNRAS, 486, 2169 [NASA ADS] [Google Scholar]
- Kleinman, S. J., Kepler, S.O., Koester, D., et al. 2013, ApJS, 204, 5 [NASA ADS] [CrossRef] [MathSciNet] [Google Scholar]
- Koester, D. 2010, Mem. Soc. Astron. It., 81, 921 [NASA ADS] [Google Scholar]
- Koester, D., & Knist, S. 2006, A&A, 454, 951 [NASA ADS] [CrossRef] [EDP Sciences] [Google Scholar]
- Koester, D., Weidemann, V., & Zeidler, E.-M. 1982, A&A, 116, 147 [NASA ADS] [Google Scholar]
- Koester, D., Provencal, J., & Gänsicke, B. T. 2014a, A&A, 568, A118 [NASA ADS] [CrossRef] [EDP Sciences] [Google Scholar]
- Koester, D., Gänsicke, B. T., & Farihi, J. 2014b, A&A, 566, A34 [NASA ADS] [CrossRef] [EDP Sciences] [Google Scholar]
- Kowalski, P. M. 2010, A&A, 519, L8 [NASA ADS] [CrossRef] [EDP Sciences] [Google Scholar]
- Kramida, A., Ralchenko, Yu., Reader, J., & NIST ASD Team 2018, NIST Atomic Spectra Database (version 5.6.1), National Institute of Standards and Technology [Google Scholar]
- Kupka, F., Piskunov, N., Ryabchikova, T. A., Stempels, H. C., & Weiss, W. W. 1999, A&AS, 138, 119 [NASA ADS] [CrossRef] [EDP Sciences] [MathSciNet] [PubMed] [Google Scholar]
- Kupka, F. G., Ryabchikova, T. A., Piskunov, N. E., Stempels, H. C., & Weiss, W. W. 2000, Balt. Astron., 9, 590 [NASA ADS] [Google Scholar]
- Liebert, J., Harris, H. C., Dahn, C. C., et al. 2003, AJ, 126, 2521 [NASA ADS] [CrossRef] [Google Scholar]
- Luo, D., & Pradhan, A. K. 1989, J. Phys. B At. Mol. Phys., 22, 3377 [NASA ADS] [CrossRef] [Google Scholar]
- Pelletier, C., Fontaine, G., Wesemael, F., Michaud, G., & Wegner, G. 1986, ApJ, 307, 242 [NASA ADS] [CrossRef] [Google Scholar]
- Piskunov, N. E., Kupka, F., Ryabchikova, T. A., Weiss, W. W., & Jeffery, C. S. 1995, A&AS, 112, 525 [NASA ADS] [Google Scholar]
- Sion, E. M., Greenstein, J. L., Landstreet, J. D., et al. 1983, ApJ, 269, 253 [NASA ADS] [CrossRef] [Google Scholar]
- Victor, G. A., & Escalante, V. 1988, At. Data Nucl. Data Tables, 40, 203 [NASA ADS] [CrossRef] [Google Scholar]
- Whitehouse, L. J., Farihi, J., Green, P. J., Wilson, T. G., & Subasavage, J. P. 2018, MNRAS, 479, 3873 [NASA ADS] [CrossRef] [Google Scholar]
- York, D. G., Adelman, J., Anderson, Jr. J. E., et al. 2000, AJ, 120, 1579 [CrossRef] [Google Scholar]
All Tables
Comparison of average surface gravities for different types of helium-rich, cool white dwarfs.
All Figures
|
Fig. 1 SDSSJ1448+0519 (gray, continuous) compared with our models using the Coutu et al. (2018) parameters (Teff, log g,[C/He] = 15776, 8.851, −1.70, red dotted) and our own best fit (15966,8.943,0.300, blue dashed). Full SDSS names are given in Table 1. |
| In the text | |
|
Fig. 2 Examples for the different carbon star types. From top to bottom: (i) a hot DQ, hDQ (SDSSJ1104+2035), (ii) a warm DQ, wDQ (SDSSJ1728+5558), (iii) a classical DQ (SDSSJ1356−0009), (iv) a DQpec (SDSSJ2232−0744), and (v) a dwarf carbon star, dC (SDSSJ1127−0212). We note theextremely sharp band heads and Balmer lines. |
| In the text | |
|
Fig. 3 Analysis results for the complete DQ sample. Top panel: log g as a function of Teff for DQ (black crosses), wDQ (red xses), and hDQ (blue squares). The large red circle is the average result for peculiar DQ as explained in Sect. 6. Bottom panel: [C/He] abundance ratios, with the same symbols as in the top panel, except for the two red asterisks, which are warm DQ with individually determined lower limit on [C/He]. The [C/He] for the hot DQ were held fixed and are typical lower limits. |
| In the text | |
Current usage metrics show cumulative count of Article Views (full-text article views including HTML views, PDF and ePub downloads, according to the available data) and Abstracts Views on Vision4Press platform.
Data correspond to usage on the plateform after 2015. The current usage metrics is available 48-96 hours after online publication and is updated daily on week days.
Initial download of the metrics may take a while.