Fig. 3
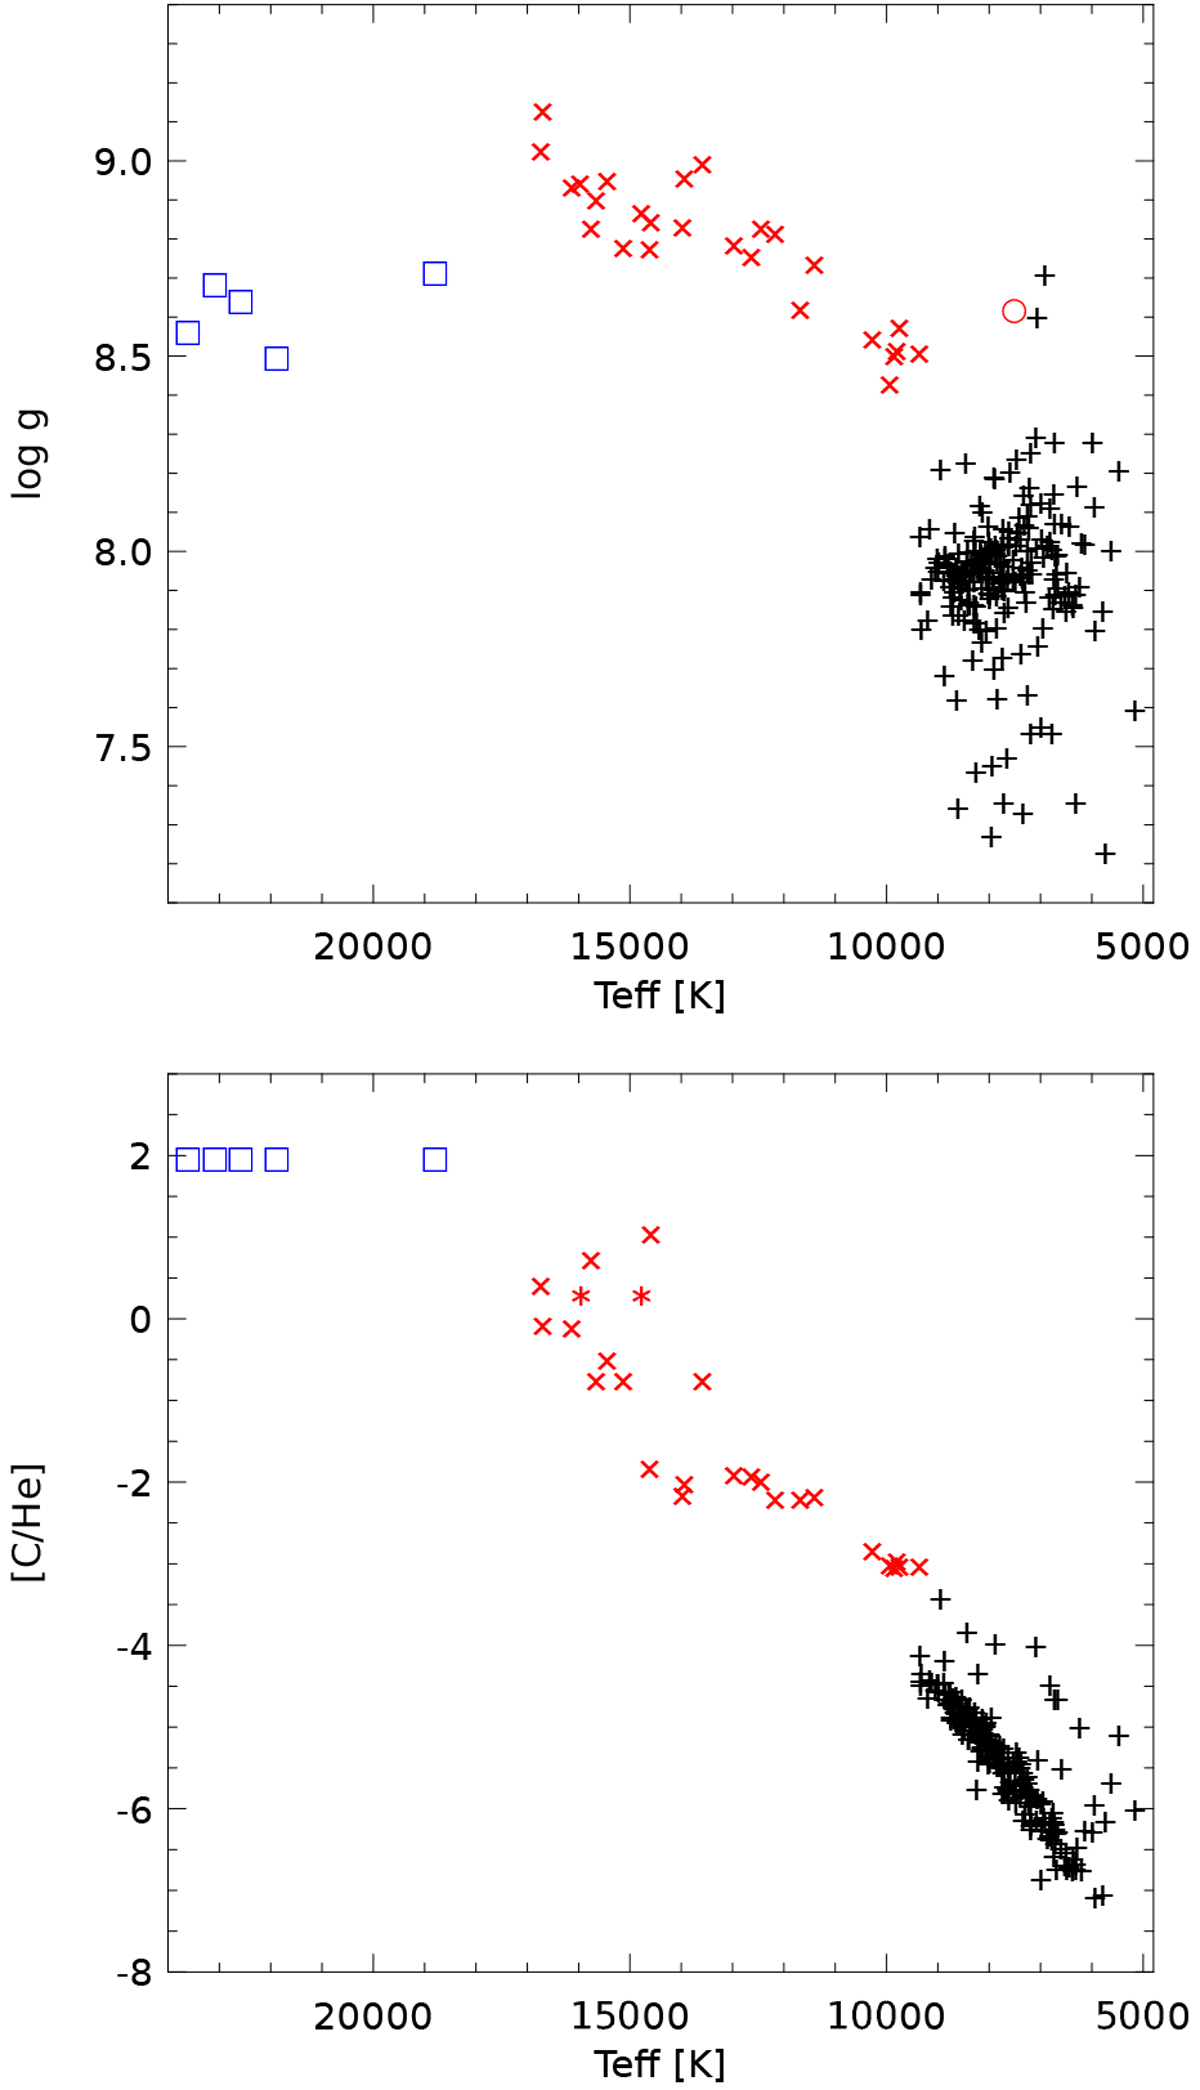
Analysis results for the complete DQ sample. Top panel: log g as a function of Teff for DQ (black crosses), wDQ (red xses), and hDQ (blue squares). The large red circle is the average result for peculiar DQ as explained in Sect. 6. Bottom panel: [C/He] abundance ratios, with the same symbols as in the top panel, except for the two red asterisks, which are warm DQ with individually determined lower limit on [C/He]. The [C/He] for the hot DQ were held fixed and are typical lower limits.
Current usage metrics show cumulative count of Article Views (full-text article views including HTML views, PDF and ePub downloads, according to the available data) and Abstracts Views on Vision4Press platform.
Data correspond to usage on the plateform after 2015. The current usage metrics is available 48-96 hours after online publication and is updated daily on week days.
Initial download of the metrics may take a while.