Fig. 8.
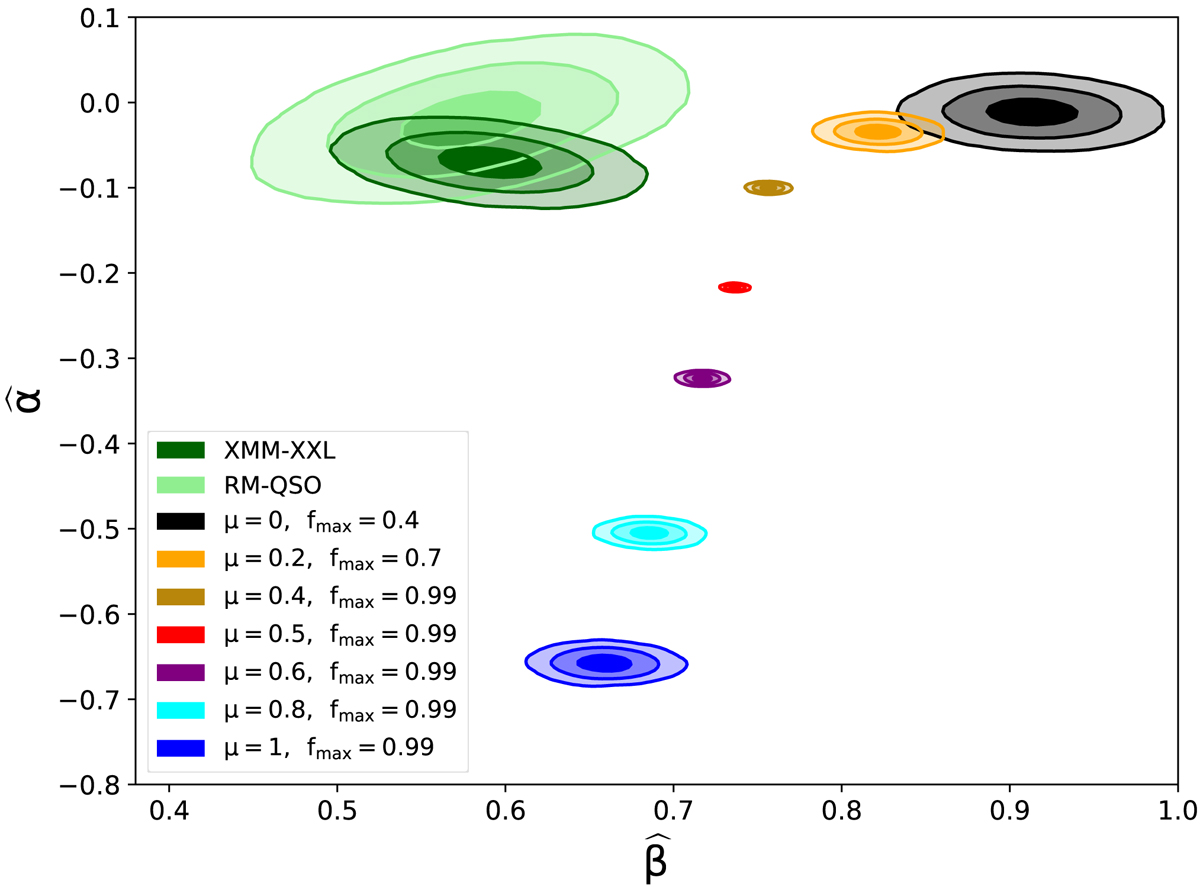
1-, 2- and 3-sigma contours of the emcee regressions in the slope-normalization (![]() ) plane of the LX − LUV for both data and models, normalizing all LX and LUV to the corresponding median values of XMM-XXL. Dark green contours are related to the cleanest XMM-XXL sample (Appendix B) and the light green ones to the RM-QSO sources. The contour of the models are color coded for μ = [0, 0.2, 0.4, 0.5, 0.6, 0.8, 1], as shown in the legend. For simplicity, we report for each μ only results obtained with a single fmax, corresponding to the highest r2-score, and fixed α0 = 0.02. Models that reproduce the observed slope
) plane of the LX − LUV for both data and models, normalizing all LX and LUV to the corresponding median values of XMM-XXL. Dark green contours are related to the cleanest XMM-XXL sample (Appendix B) and the light green ones to the RM-QSO sources. The contour of the models are color coded for μ = [0, 0.2, 0.4, 0.5, 0.6, 0.8, 1], as shown in the legend. For simplicity, we report for each μ only results obtained with a single fmax, corresponding to the highest r2-score, and fixed α0 = 0.02. Models that reproduce the observed slope ![]() are also the ones that show weaker coronae (lower normalization
are also the ones that show weaker coronae (lower normalization ![]() ).
).
Current usage metrics show cumulative count of Article Views (full-text article views including HTML views, PDF and ePub downloads, according to the available data) and Abstracts Views on Vision4Press platform.
Data correspond to usage on the plateform after 2015. The current usage metrics is available 48-96 hours after online publication and is updated daily on week days.
Initial download of the metrics may take a while.