Fig. 7.
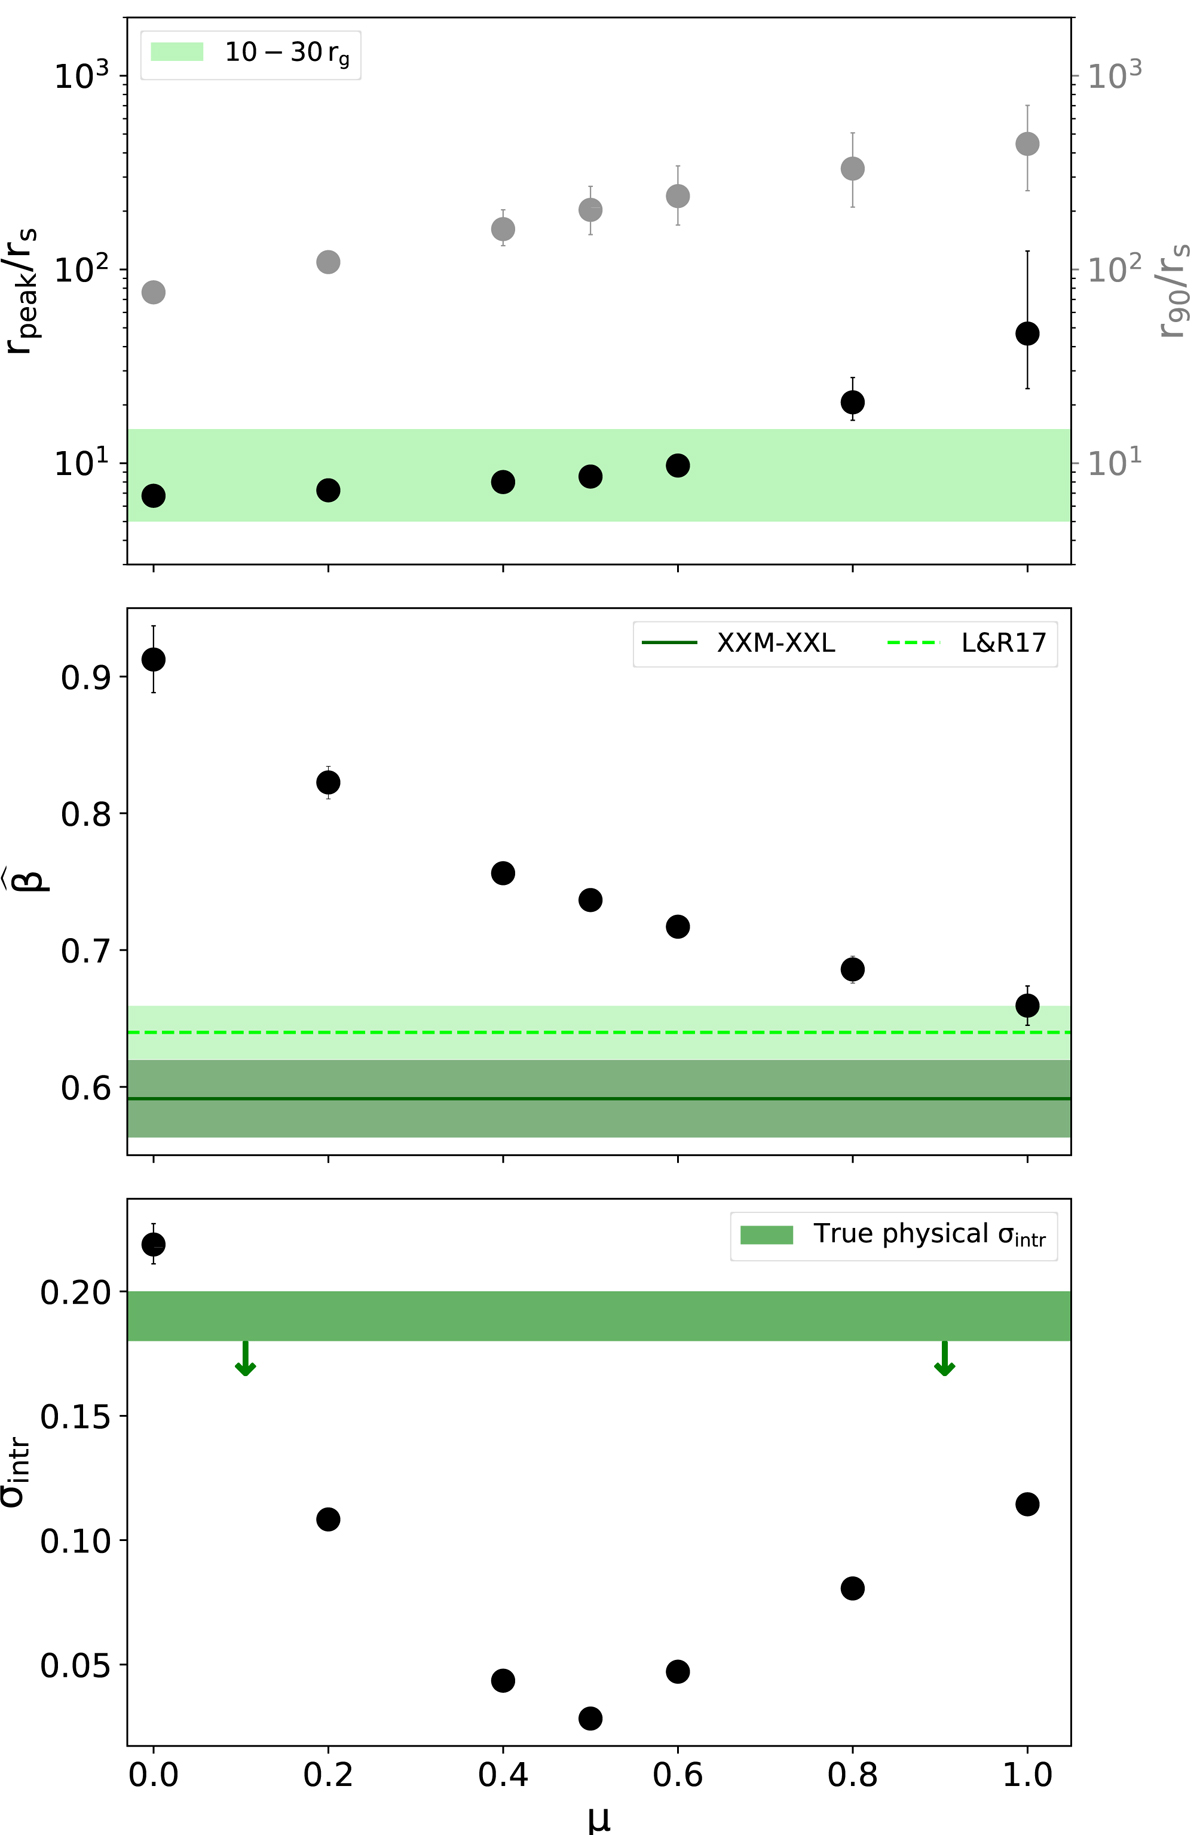
Top panel: the 2 keV-emission rpeak (r90) as a function of μ is represented in black (gray). The green shaded area qualitatively shows the inner radii, where the bulk of X-ray emission is supposed to come from according to X-ray reverberation and micro-lensing. For increasing μ, the X-ray emission profile peaks at larger radii. Middle panel: for increasing μ the models obtain a slope of the LX − LUV closer to the observed one. The dark-green area represents the reference slope of the cleanest XXM-XXL (Appendix B), while the light-green refers to the slope quoted in LR17. Bottom panel: intrinsic scatter of the mock LX − LUV relations as a function of μ. The green area represents a tentative upper limit of the true scatter (Lusso & Risaliti 2016; Chiaraluce et al. 2018), that is only due to the physical properties of AGN. For simplicity, all panels show only the results obtained with a single fmax, corresponding to the highest r2-score (e.g., Fig. 6), and fixed α0 = 0.02.
Current usage metrics show cumulative count of Article Views (full-text article views including HTML views, PDF and ePub downloads, according to the available data) and Abstracts Views on Vision4Press platform.
Data correspond to usage on the plateform after 2015. The current usage metrics is available 48-96 hours after online publication and is updated daily on week days.
Initial download of the metrics may take a while.