Fig. 6.
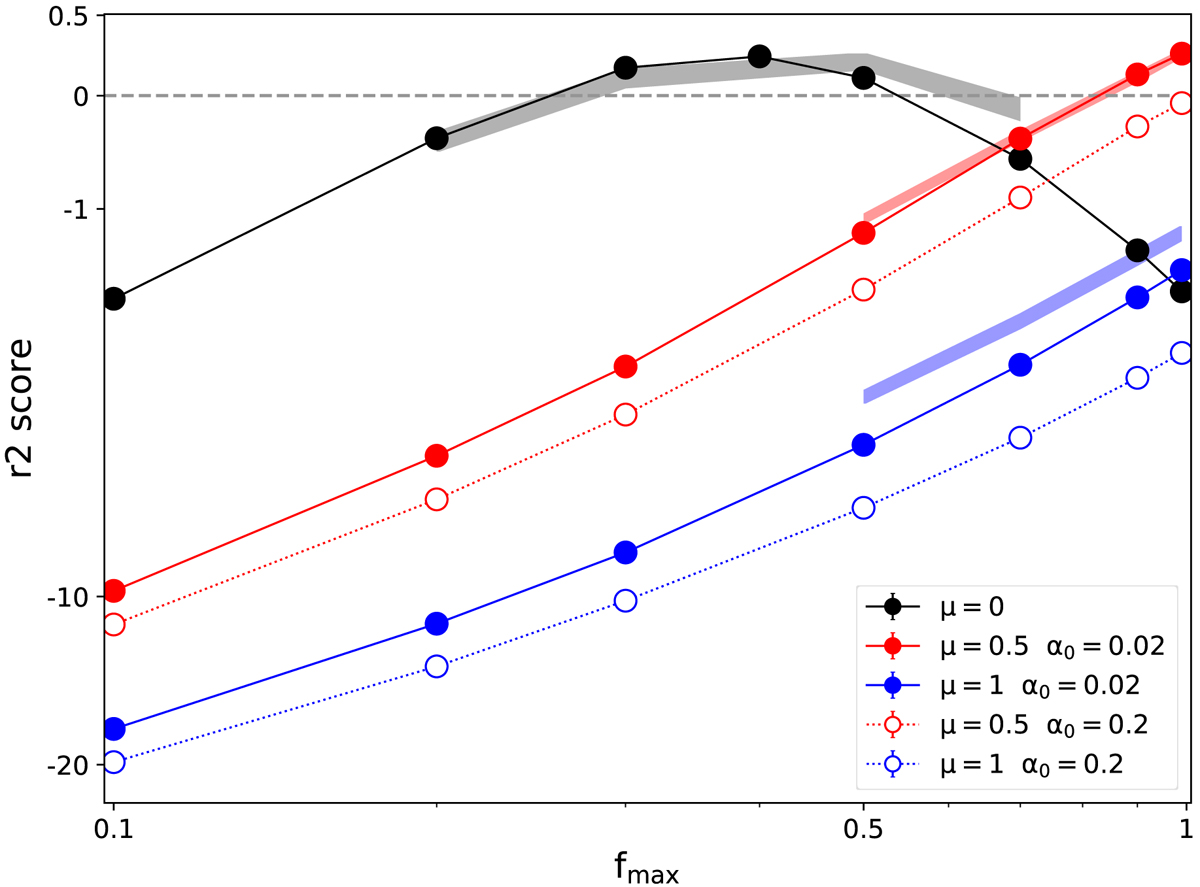
r2 score, representing the goodness of match between XMM-XXL and mocks (see text), as a function of fmax. Models with μ = 0, 0.5, 1 are color coded in black, red and blue, respectively. The additional dependency on α0 is represented with varying line-types as shown in the legend, when present (it is absent for μ = 0). A good match is represented with a score greater than zero. The points include the uncertainties in the score values. The shaded areas represent the results obtained applying the same methodology on a different sample (RM-QSO, Liu et al., in prep.), fixing α0 = 0.02 and using the same colors.
Current usage metrics show cumulative count of Article Views (full-text article views including HTML views, PDF and ePub downloads, according to the available data) and Abstracts Views on Vision4Press platform.
Data correspond to usage on the plateform after 2015. The current usage metrics is available 48-96 hours after online publication and is updated daily on week days.
Initial download of the metrics may take a while.