Fig. 5.
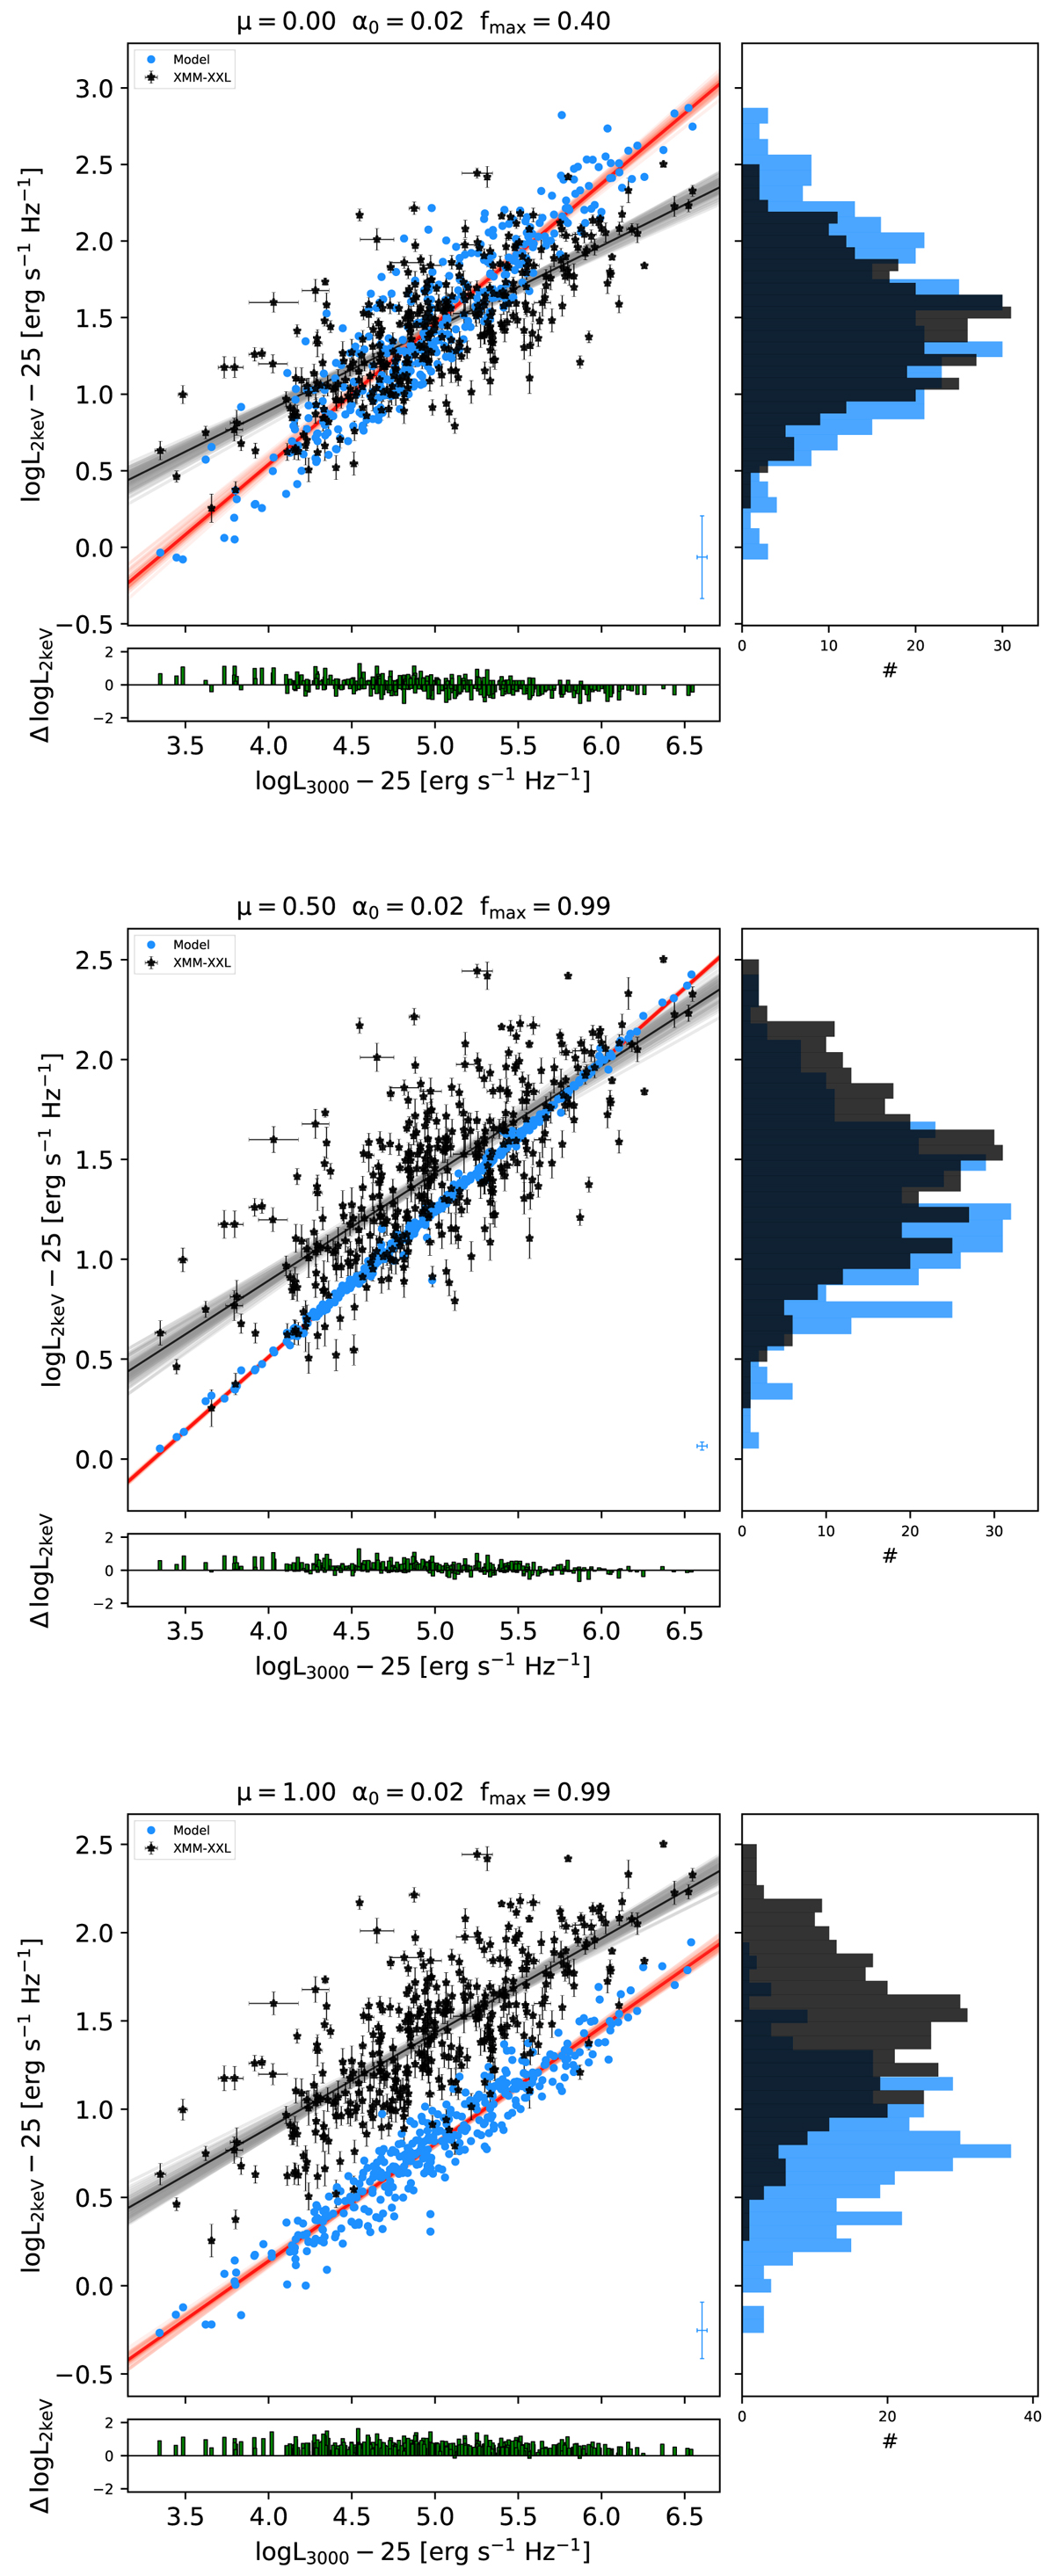
The central panel of each image shows an example of the LX − LUV relation for both XMM-XXL (black stars) and the model (blue dots), in which the choice of μ, α0 and fmax is shown in the titles. The black and red solid lines are randomly drawn from the posterior distributions of normalization and slope for XMM-XXL and the model, respectively, with the median regression line thickened. The bottom panels show the residuals given by the difference of observed and mock log L2 keV and the right panels show the related distributions. The errors on the model are show in the bottom right corner of the central panels.
Current usage metrics show cumulative count of Article Views (full-text article views including HTML views, PDF and ePub downloads, according to the available data) and Abstracts Views on Vision4Press platform.
Data correspond to usage on the plateform after 2015. The current usage metrics is available 48-96 hours after online publication and is updated daily on week days.
Initial download of the metrics may take a while.