Fig. 4.
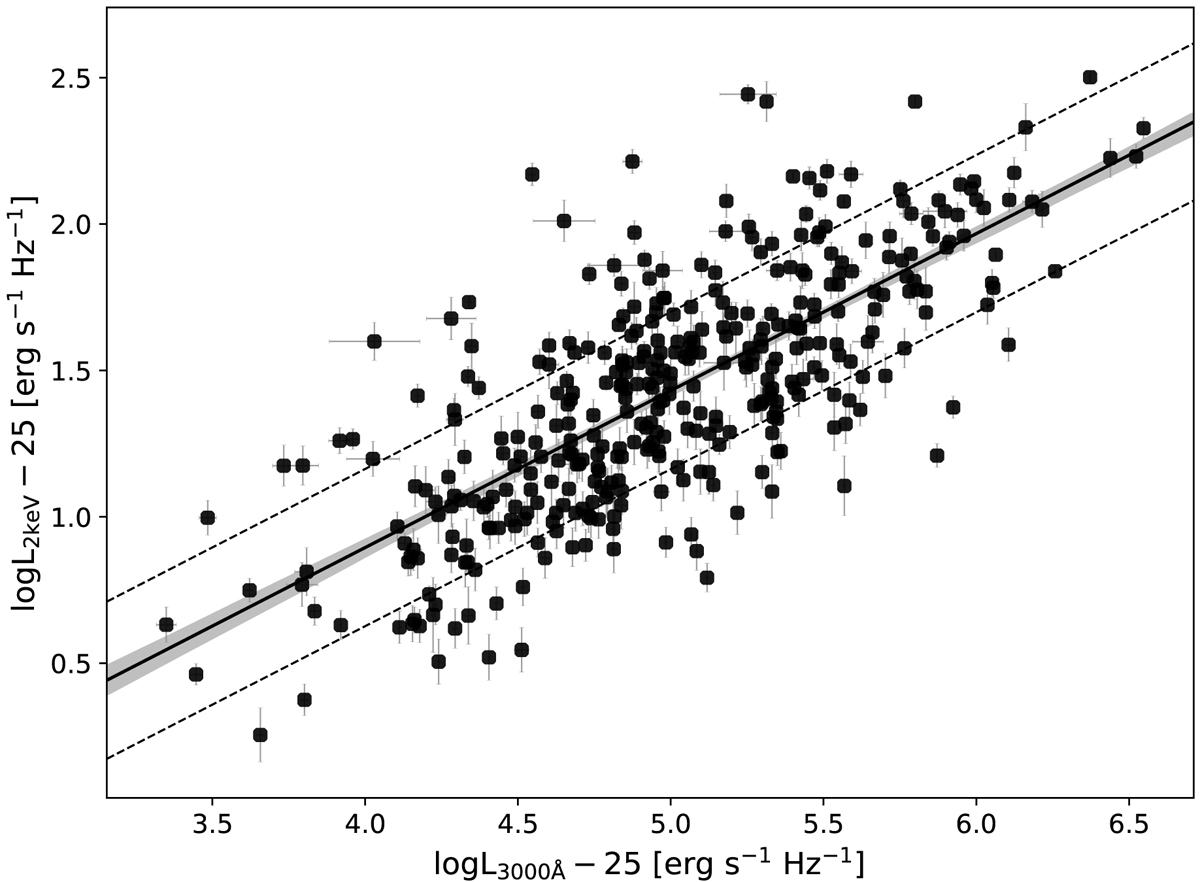
LX − LUV relation of the 379 bright BLAGN of XMM-XXL. Monochromatic luminosity values are here scaled by 25 dex, to ease the comparison with recent works. The solid black line is the median regression line obtained with emcee, with the corresponding 16th and 84th percentiles represented with the shaded gray area. The dashed black lines show the intrinsic scatter around the median relation.
Current usage metrics show cumulative count of Article Views (full-text article views including HTML views, PDF and ePub downloads, according to the available data) and Abstracts Views on Vision4Press platform.
Data correspond to usage on the plateform after 2015. The current usage metrics is available 48-96 hours after online publication and is updated daily on week days.
Initial download of the metrics may take a while.