Fig. 3.
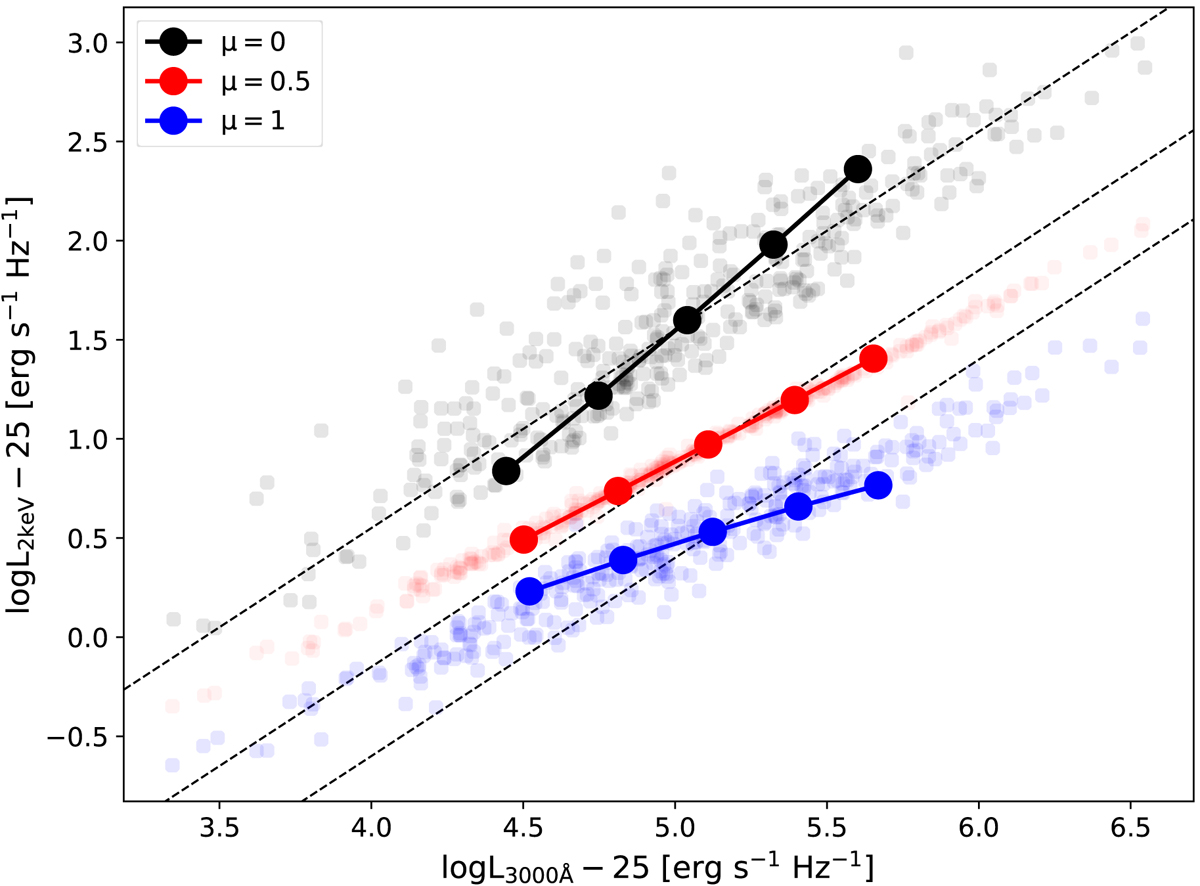
Mock LX − LUV with fixed fmax = 0.5 and different μ color coded, as in Fig. 1. The connected solid points show the trend of a single typical mass (log m = 8.7) with ṁ = 0.03, 0.07, 0.17, 0.42, 1 (increasing from left to right in LUV). The dashed lines indicate a slope of one. The distributions of transparent points show the mock LX − LUV for a range of ![]() ,
, ![]() and Γ = 2.1 ± 0.1, that follows the typically observed objects (see Sect. 4).
and Γ = 2.1 ± 0.1, that follows the typically observed objects (see Sect. 4).
Current usage metrics show cumulative count of Article Views (full-text article views including HTML views, PDF and ePub downloads, according to the available data) and Abstracts Views on Vision4Press platform.
Data correspond to usage on the plateform after 2015. The current usage metrics is available 48-96 hours after online publication and is updated daily on week days.
Initial download of the metrics may take a while.