Fig. B.2.
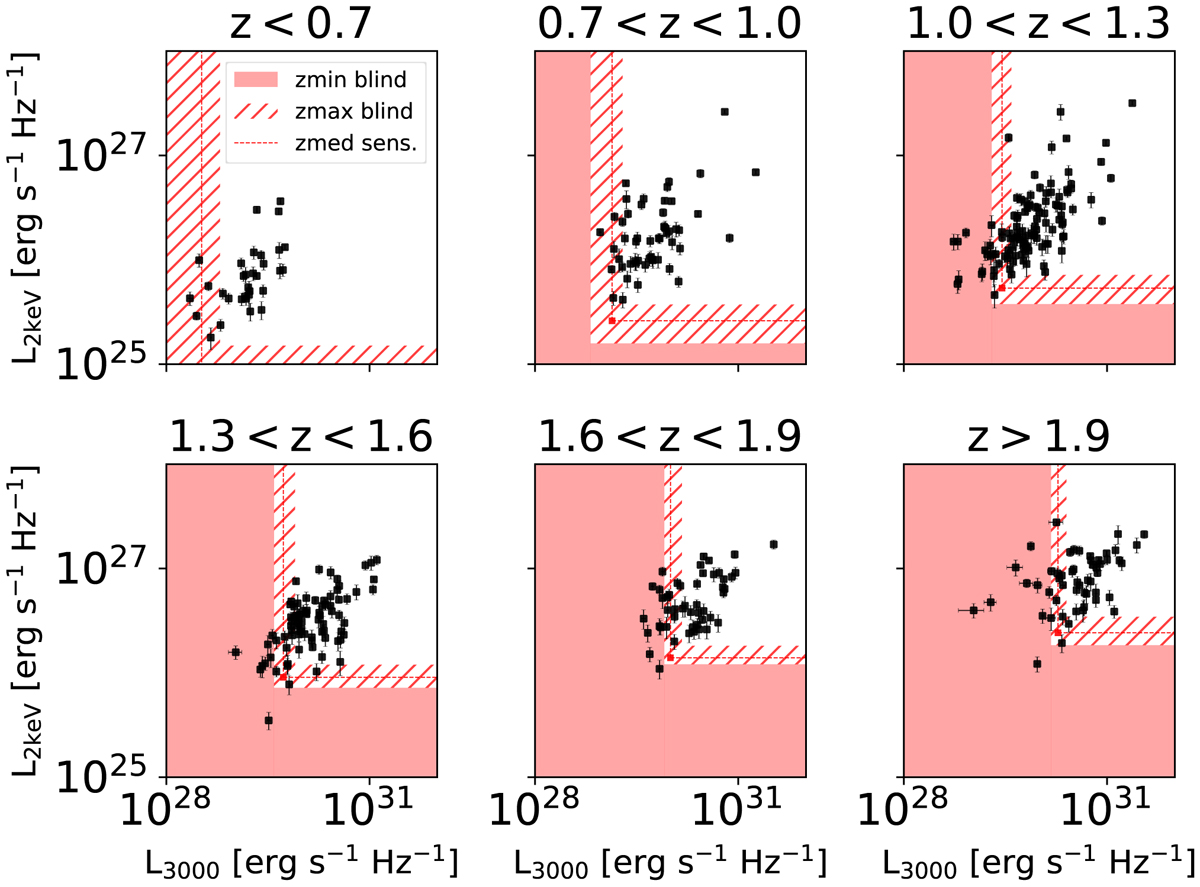
LX − LUV relation in the redshift bins reported in the sub-titles. The sensitivity surfaces at the minimum, median and maximum redshift of the bin are represented in red with a full area, a dashed line and a shaded area respectively. These surfaces are obtained from the sensitivity lines in Fig. B.1 at the above-mentioned redshifts. The sources above the shaded sensitivity area in each z-bin give the cleanest XMM-XXL sample.
Current usage metrics show cumulative count of Article Views (full-text article views including HTML views, PDF and ePub downloads, according to the available data) and Abstracts Views on Vision4Press platform.
Data correspond to usage on the plateform after 2015. The current usage metrics is available 48-96 hours after online publication and is updated daily on week days.
Initial download of the metrics may take a while.