Fig. B.1.
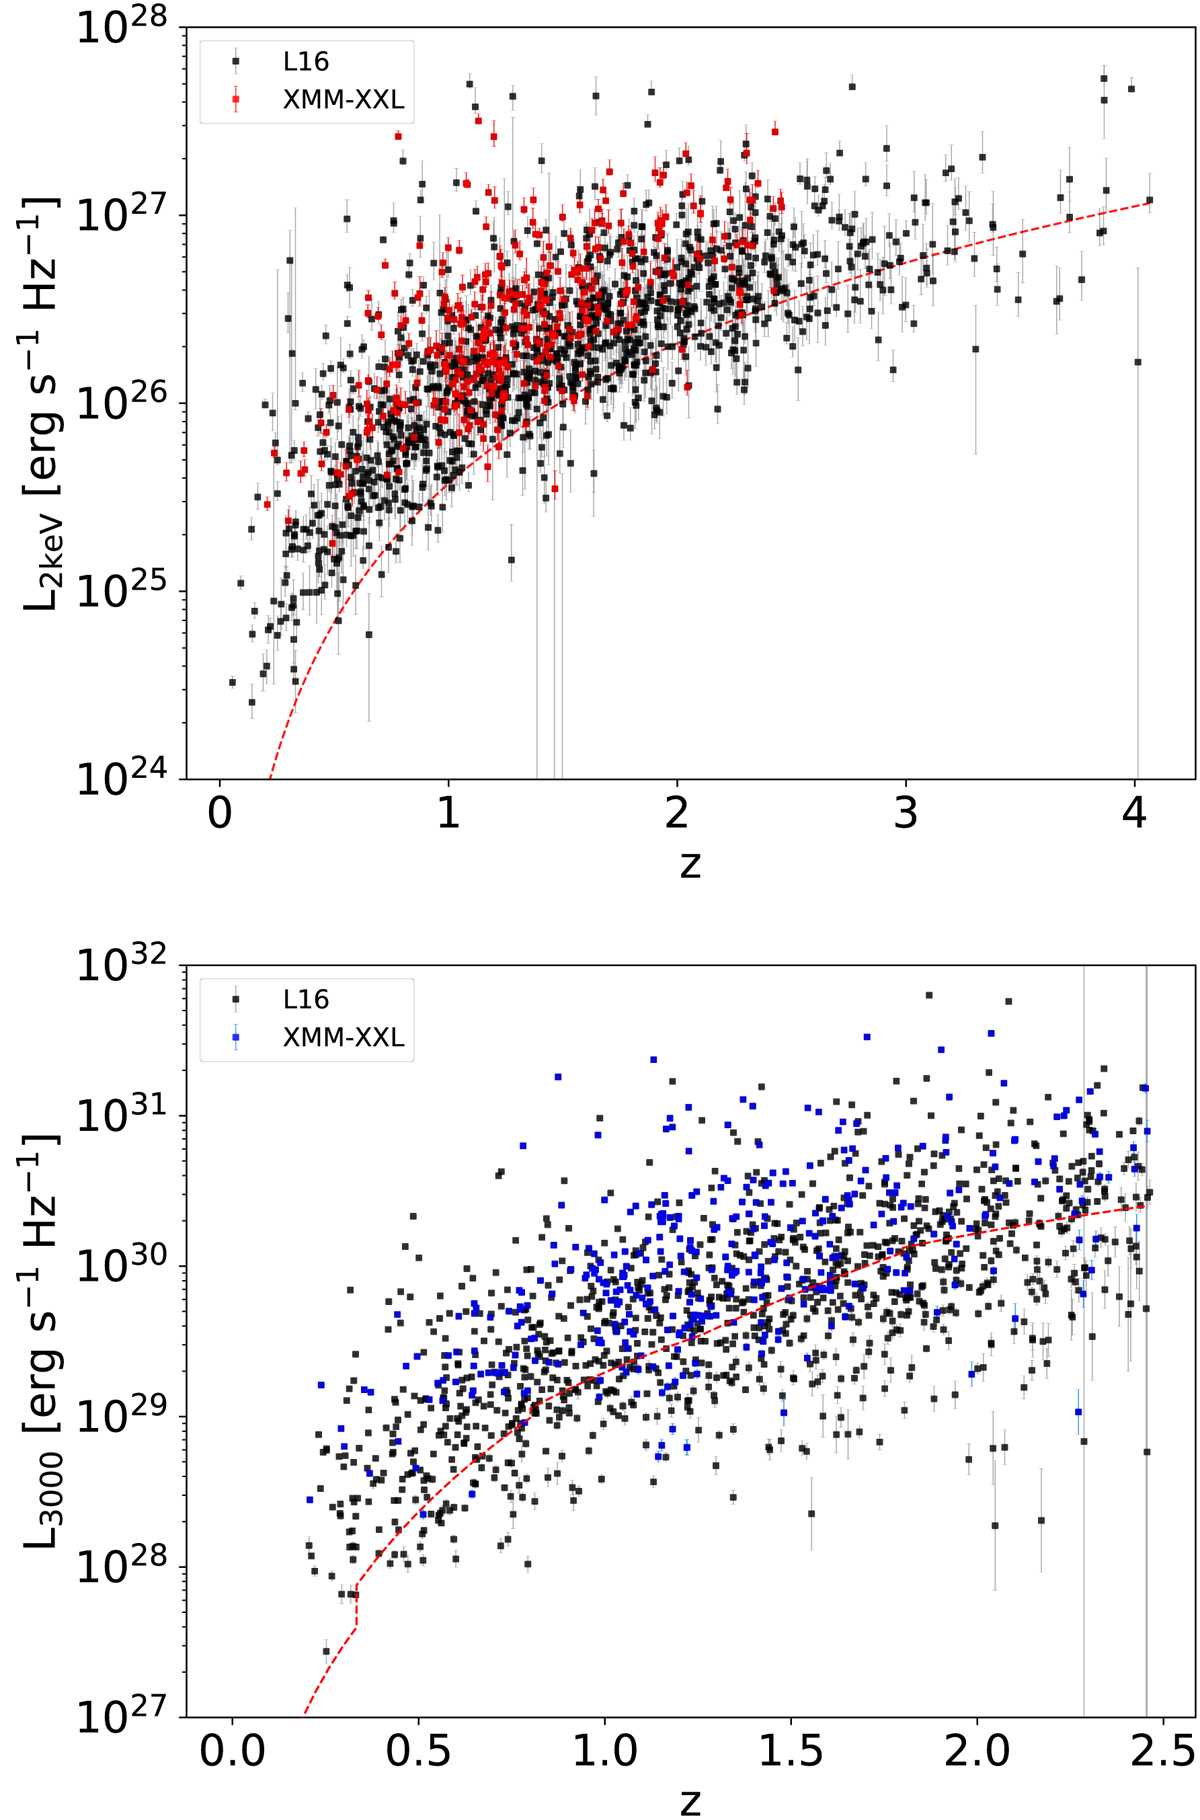
Distribution of L2 keV (top panel) and L3000 Å (bottom panel) in the luminosity-redshift plane of the 379 sources of our XMM-XXL sample (red and blue respectively), with respect to the parent sample of BLAGN from L16 (black). The dashed red lines broadly represent the sensitivity of the survey at the related frequency (see the text for a description).
Current usage metrics show cumulative count of Article Views (full-text article views including HTML views, PDF and ePub downloads, according to the available data) and Abstracts Views on Vision4Press platform.
Data correspond to usage on the plateform after 2015. The current usage metrics is available 48-96 hours after online publication and is updated daily on week days.
Initial download of the metrics may take a while.