Fig. 10.
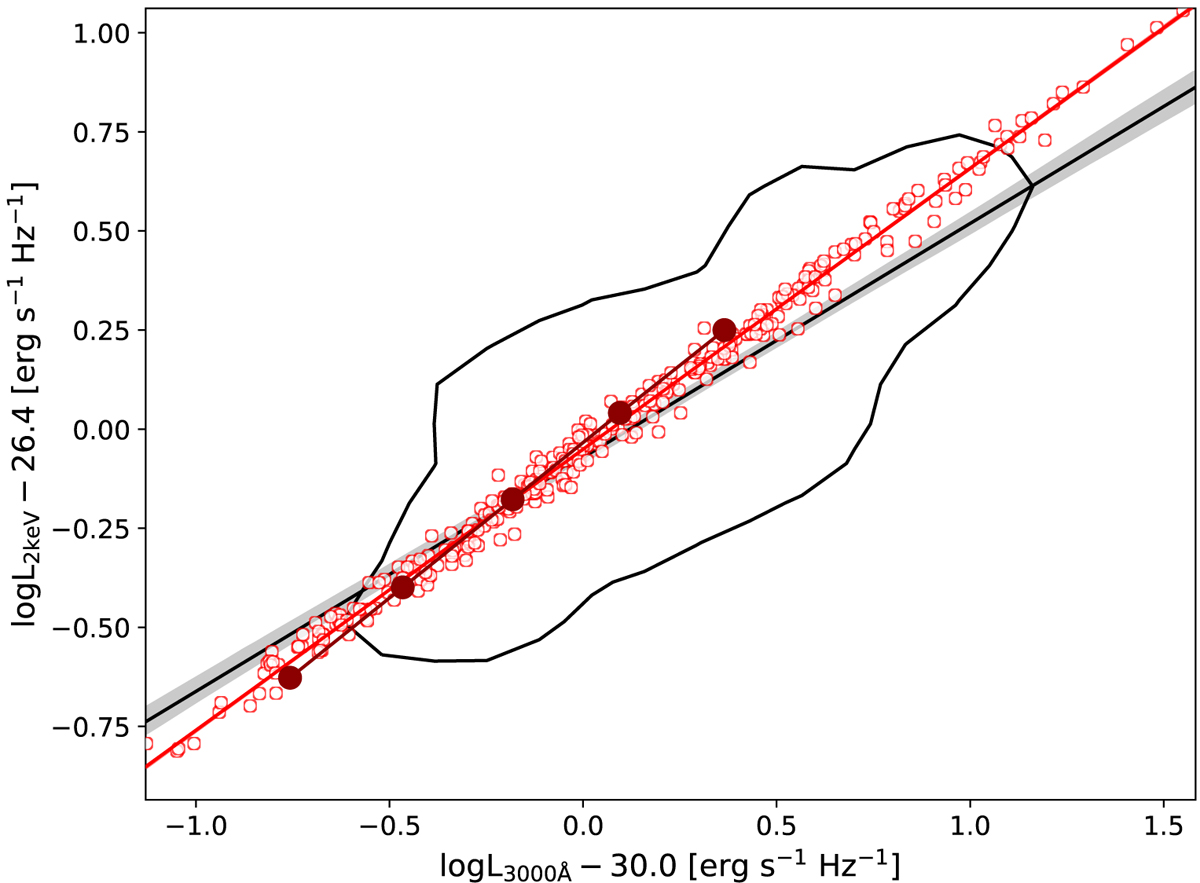
LX − LUV relation for the high-spin model with μ = 0.5, α0 = 0.02 and fmax = 0.9 (empty red points, corresponding to the empty red contour in Fig. 9), with the red line showing best fit slope from emcee. The connected filled points (dark red) show the single-mass trend (log m = 8.7) for varying accretion rate (0.03, 0.07, 0.17, 0.42, 1). For a comparison, the black contour shows where the data lie in the plane, with the related best-fit slope (black line).
Current usage metrics show cumulative count of Article Views (full-text article views including HTML views, PDF and ePub downloads, according to the available data) and Abstracts Views on Vision4Press platform.
Data correspond to usage on the plateform after 2015. The current usage metrics is available 48-96 hours after online publication and is updated daily on week days.
Initial download of the metrics may take a while.