Fig. 1.
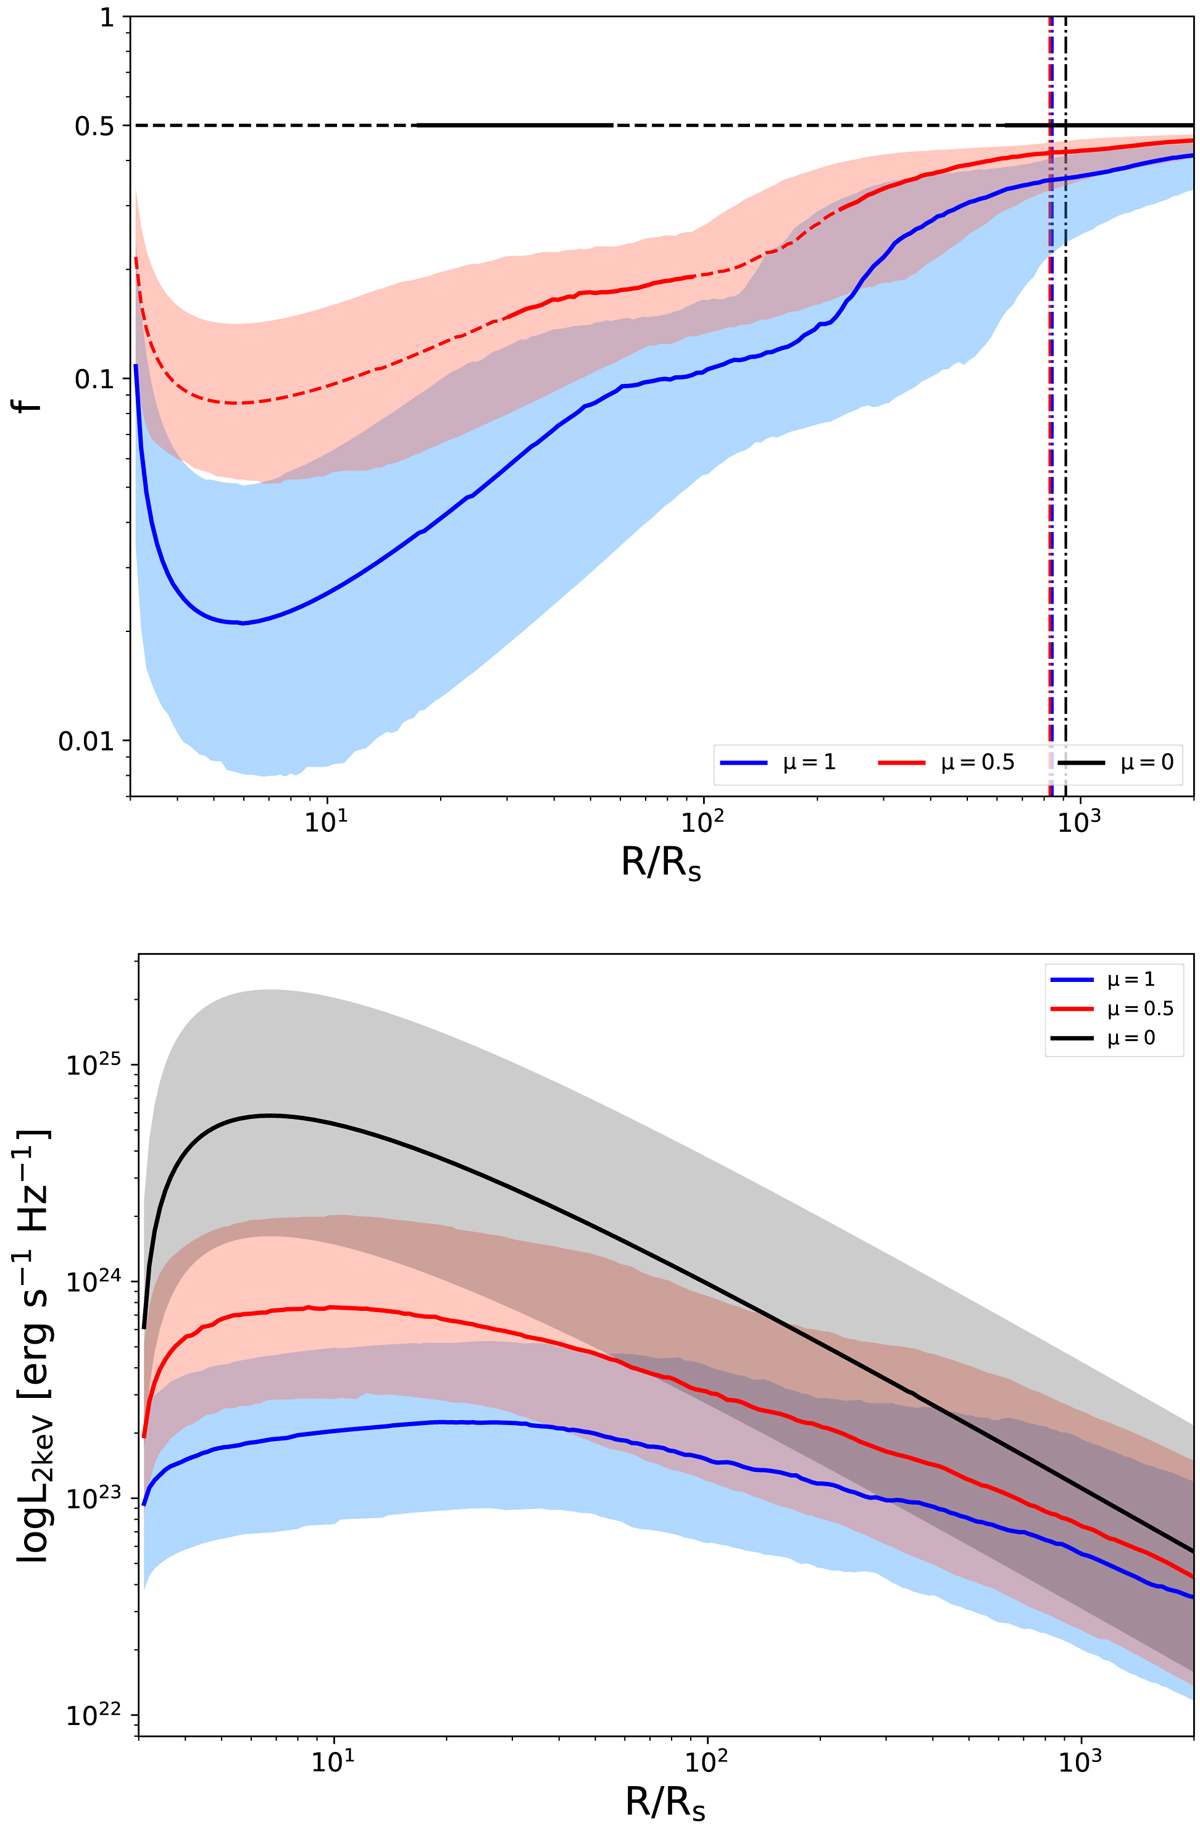
Radial profiles for the fraction f of power dissipated in the corona (top panel) and L2 keV (bottom panel), obtained with fixed α0 = 0.02 and fmax = 0.5. Colors are coded according to the choice of the viscosity law: stress proportional to Ptot (Pgas + Prad, μ = 0, black), to Pgas (μ = 1, blue), or the geometric mean of the two (μ = 0.5, red). The continuous solid, or solid-dashed, lines represent the median profiles, with the related shaded areas showing the 16th and 84th percentiles, the scatter due to the range of sources (i.e. m and ṁ) modeled. L2 keV is proportional to the product of f and Q+ (the accretion power per unit area). As Q+ has very similar profiles across all models, those systems for which f is smaller produce weaker coronae in the central part. Top panel: a solid line for the median f-profile represents (thermally) stable regions of the median test source, whereas a dashed line highlights the instability regions. The vertical dot-dashed lines show instead where the median transition radius, from Prad- to Pgas-dominated regions, lies. Refer to Sect. 2.1 for details.
Current usage metrics show cumulative count of Article Views (full-text article views including HTML views, PDF and ePub downloads, according to the available data) and Abstracts Views on Vision4Press platform.
Data correspond to usage on the plateform after 2015. The current usage metrics is available 48-96 hours after online publication and is updated daily on week days.
Initial download of the metrics may take a while.