Fig. 8
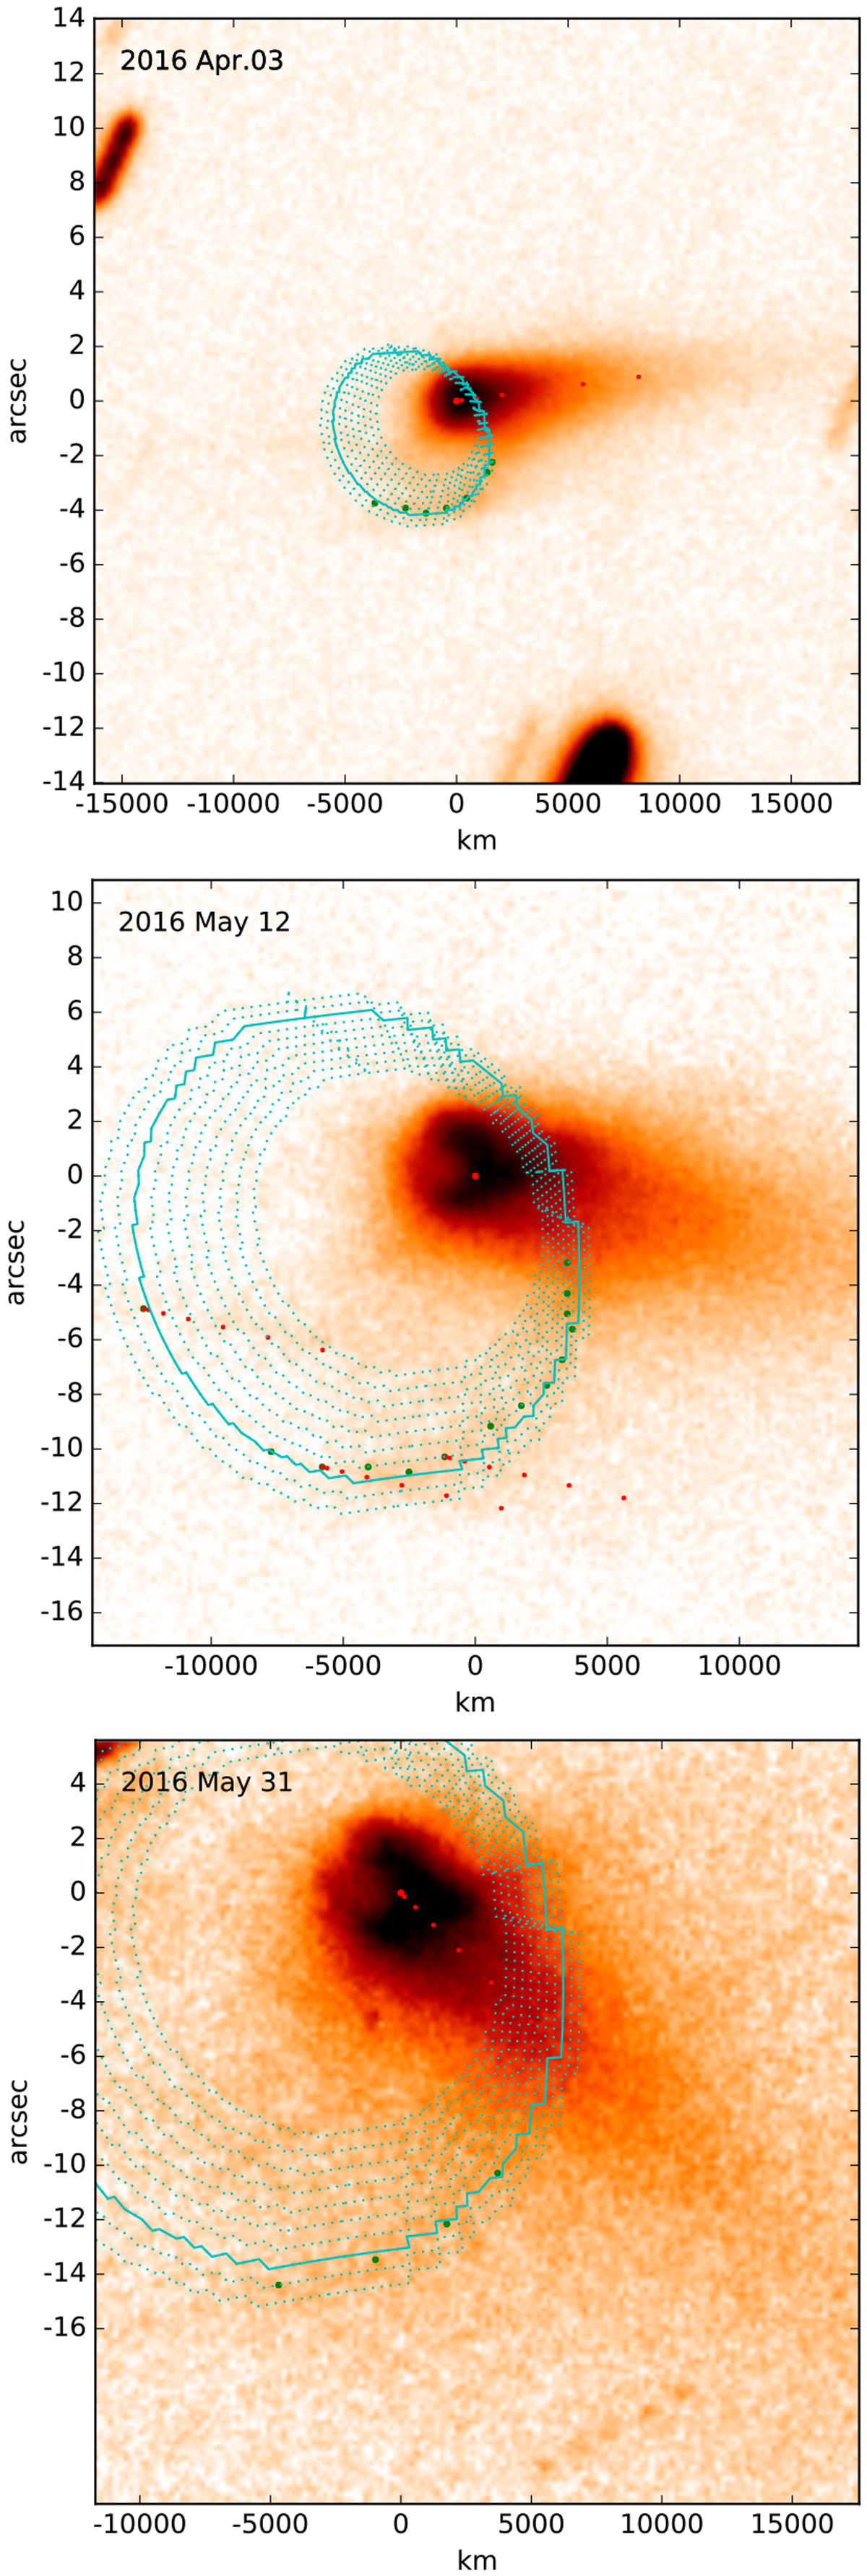
P/2016 G1 on 2016 April 3, May 12, and May 31. The green dots mark clumps on the arc feature. The small red dots correspond to the synchrone trajectories of small dust (submitted to radiation pressure) emitted from some of the clumps on March 6. The position of large particles emitted on March 6 on a cone with half-opening 40° and centred on (long., lat.) = (68°, −15°) are over-plotted for velocities ranging from 1.625 to 2.750 m s−1. The solid line corresponds to 2.5 m s−1.
Current usage metrics show cumulative count of Article Views (full-text article views including HTML views, PDF and ePub downloads, according to the available data) and Abstracts Views on Vision4Press platform.
Data correspond to usage on the plateform after 2015. The current usage metrics is available 48-96 hours after online publication and is updated daily on week days.
Initial download of the metrics may take a while.