Fig. 6
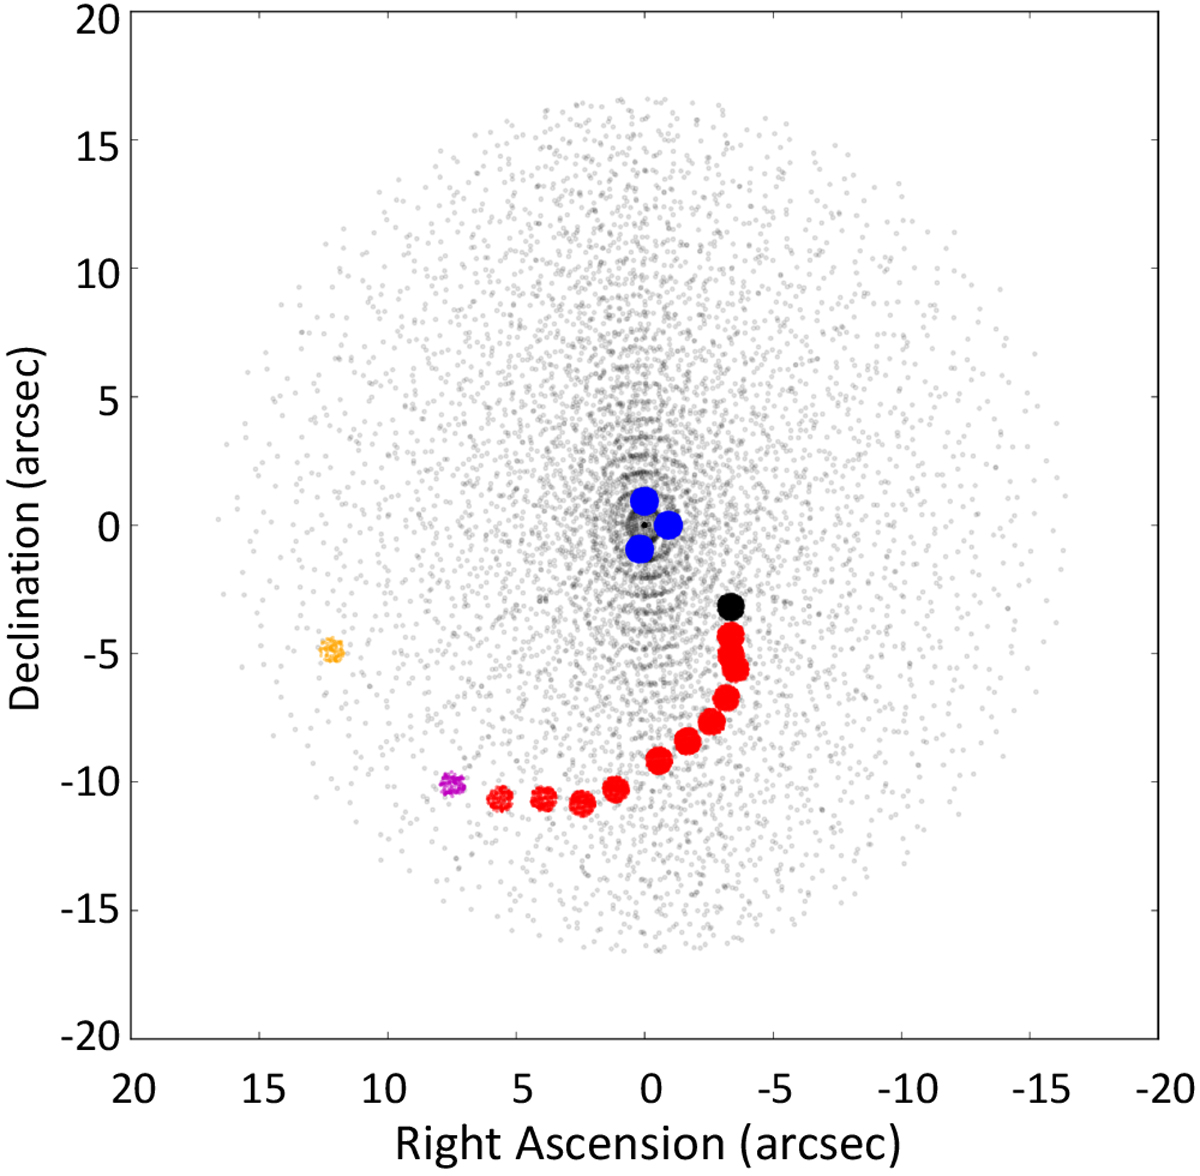
Positions of large particles emitted by the nucleus on 2016 March 6, with velocities ranging from 0 to 3 m s−1 observed on 2017 May 12 marked with light grey dots in the plane of sky. The coordinates mark offsets from the position of the nucleus for that time. For clarity, only a subset of the particles is plotted. The particles matching the position of the three head features are marked in blue. Those matching the arc are marked in red (the ends of the feature are marked in magenta and black); the blob at the western start of the linear feature (Fig. 2) is marked in orange.
Current usage metrics show cumulative count of Article Views (full-text article views including HTML views, PDF and ePub downloads, according to the available data) and Abstracts Views on Vision4Press platform.
Data correspond to usage on the plateform after 2015. The current usage metrics is available 48-96 hours after online publication and is updated daily on week days.
Initial download of the metrics may take a while.