Fig. 2
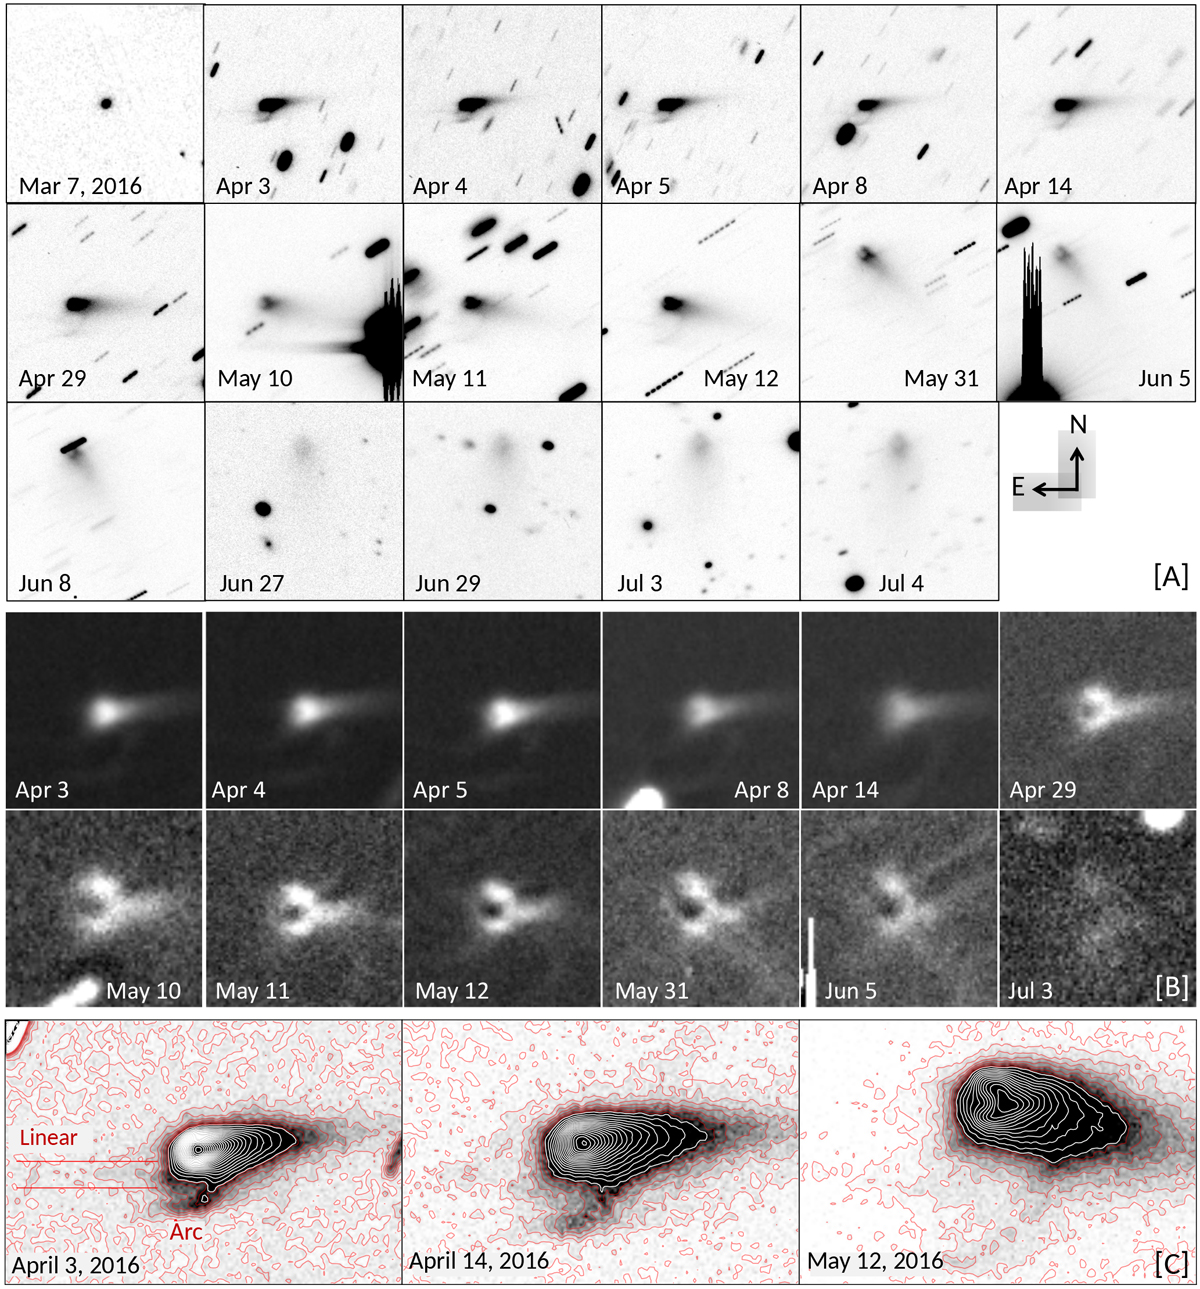
Panels A: images of P/2016 G1 between UT 2016 March 7 and July 4. All the images are scaled to be 6 × 10⁴ km on a side. The Earth crossed the orbital plane of the object on April 13, so images around that date show the coma extension above and below the plane. Panels B: images of P/2016 G1 processed with unsharp masking to enhance the three clumps and the details near the disintegrating body. Each image is 1.5 × 10⁴ km on a side. Panels C: contour plots on three dates showing the expansion of the southern arc and the eastern linear feature (highlighted with red lines). Each panel is 30″ × 20″. The panel widths and pixel scales are: April 3 (34 000 km, 227 km), April 14 (32 000 km, 231 km), and May 12 (29 000 km, 193 km). North is up, east is left. The Sun and velocity vectors are listed in Table A.1.
Current usage metrics show cumulative count of Article Views (full-text article views including HTML views, PDF and ePub downloads, according to the available data) and Abstracts Views on Vision4Press platform.
Data correspond to usage on the plateform after 2015. The current usage metrics is available 48-96 hours after online publication and is updated daily on week days.
Initial download of the metrics may take a while.