Fig. 7
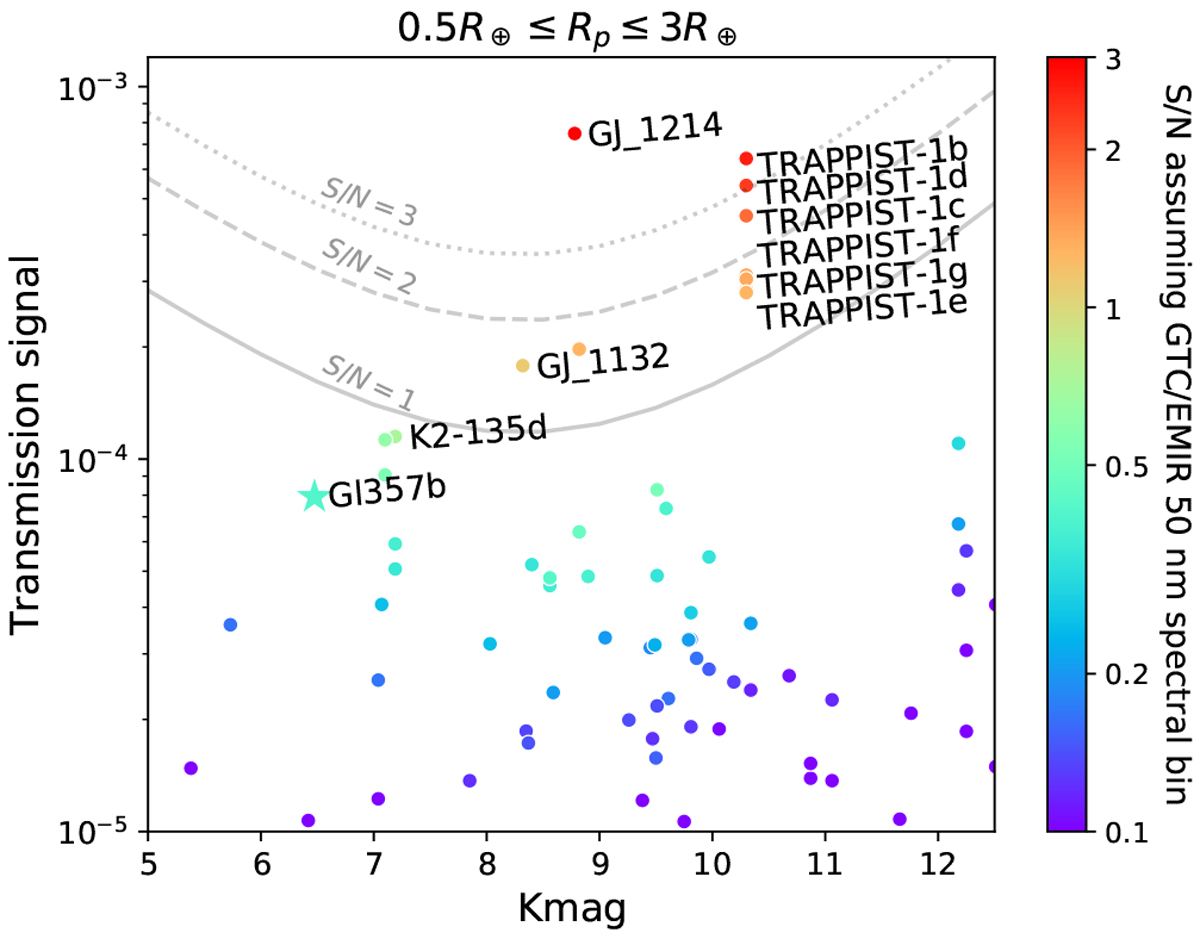
Expected primary transit transmission signal per scale height plotted against the K-band magnitude of GJ 357 b (star) and all know planets (dots) with mass measurements and with radius between 0.5 and 3 R⊕. The color scale provides the expected S/N for a single transit assuming the use of a ten-meter telescope and 50 nm wavelength integration bins. The gray lines indicate the pattern of the S/N assuming a single transit duration of 3 h. The relative S/N is maintained when extrapolated to other instrumentation. A few benchmark targets for JWST transmission spectroscopy studies are labeled.
Current usage metrics show cumulative count of Article Views (full-text article views including HTML views, PDF and ePub downloads, according to the available data) and Abstracts Views on Vision4Press platform.
Data correspond to usage on the plateform after 2015. The current usage metrics is available 48-96 hours after online publication and is updated daily on week days.
Initial download of the metrics may take a while.