Fig. 5
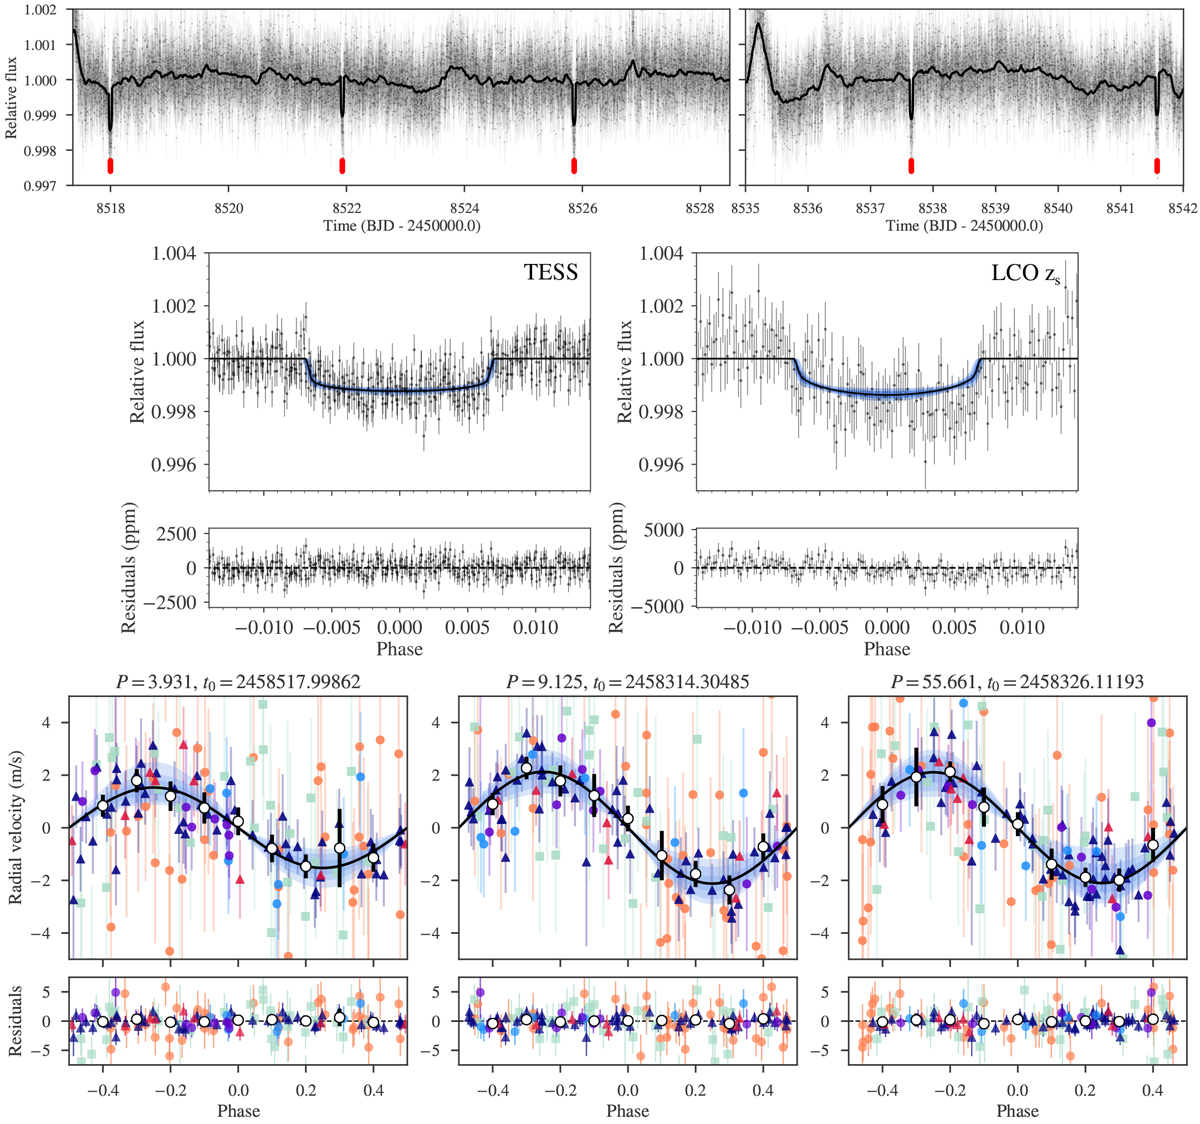
Results from the joint fit of the best model 3pl+GPexp. Top panel: TESS photometry time series (gray points with error bars) along with the best-fit model (solid black line) from our joint modeling. This best-fit model includes an exponential GP used to account for the evident trends as well as for a transit model. Individual transits of GJ 357 b are indicated with red ticks. Middle panel: TESS photometry (left) and LCO photometry (right) phase-folded to the 3.93 d period of GJ 357 b along with best-fit transit model from the joint fit. The GP fitted to the photometry has been removed. Bottom panel: RVs phase-folded to the period of the three confirmed planets (GJ 357 b, left; GJ 357 c, center; GJ 357 d, right). RV data come from HIRES (orange circles), UVES (light green squares), HARPS (navy blue triangles), PFSpre (light blue circles), PFSpost (red triangles), and CARMENES (purple circles). The GP fitted to the RV dataset has been removed. White circles show binned datapoints in phase for visualisation. The error bars of both photometry and RV data include their corresponding jitter.
Current usage metrics show cumulative count of Article Views (full-text article views including HTML views, PDF and ePub downloads, according to the available data) and Abstracts Views on Vision4Press platform.
Data correspond to usage on the plateform after 2015. The current usage metrics is available 48-96 hours after online publication and is updated daily on week days.
Initial download of the metrics may take a while.