Fig. 4
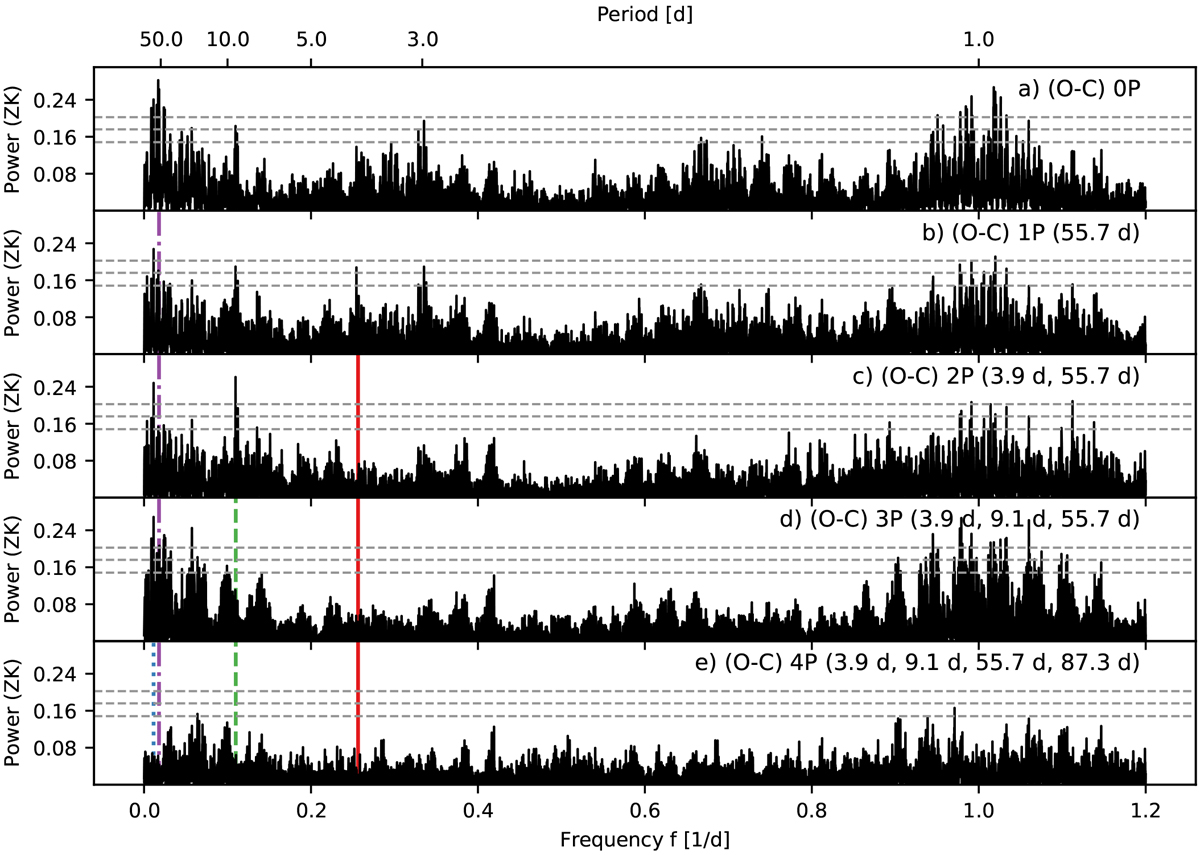
Generalized Lomb–Scargle periodograms of the residual RVs after subtraction of different models. Panel a: no signal subtracted, only instrumental offsets and jitter fitted. Panel b: periodogram of the RV residuals after the subtraction of one sinusoidal signal with P = 55.7 d (vertical purple dashed-dotted line). Panel c: periodogram of the RV residuals after the simultaneous modeling of two signals with periods at 3.93 d (red solid line) and 55.7 d. Panel d: periodogram of the RV residuals after the simultaneous modeling of three periodic signals with P = 55.7 d, P = 3.93 d, and P = 9.1 d (green dashed line). Panel e: periodogram of the RV residuals after the simultaneous modeling of four periodic signals with P = 55.7 d, P = 3.93 d, P = 9.1 d, and P ~ 87 d (blue dotted line). The gray dashed lines indicate from bottom to top the analytic 10, 1, and 0.1% FAP levels, respectively.
Current usage metrics show cumulative count of Article Views (full-text article views including HTML views, PDF and ePub downloads, according to the available data) and Abstracts Views on Vision4Press platform.
Data correspond to usage on the plateform after 2015. The current usage metrics is available 48-96 hours after online publication and is updated daily on week days.
Initial download of the metrics may take a while.