Press Release
Free Access
Fig. B.1
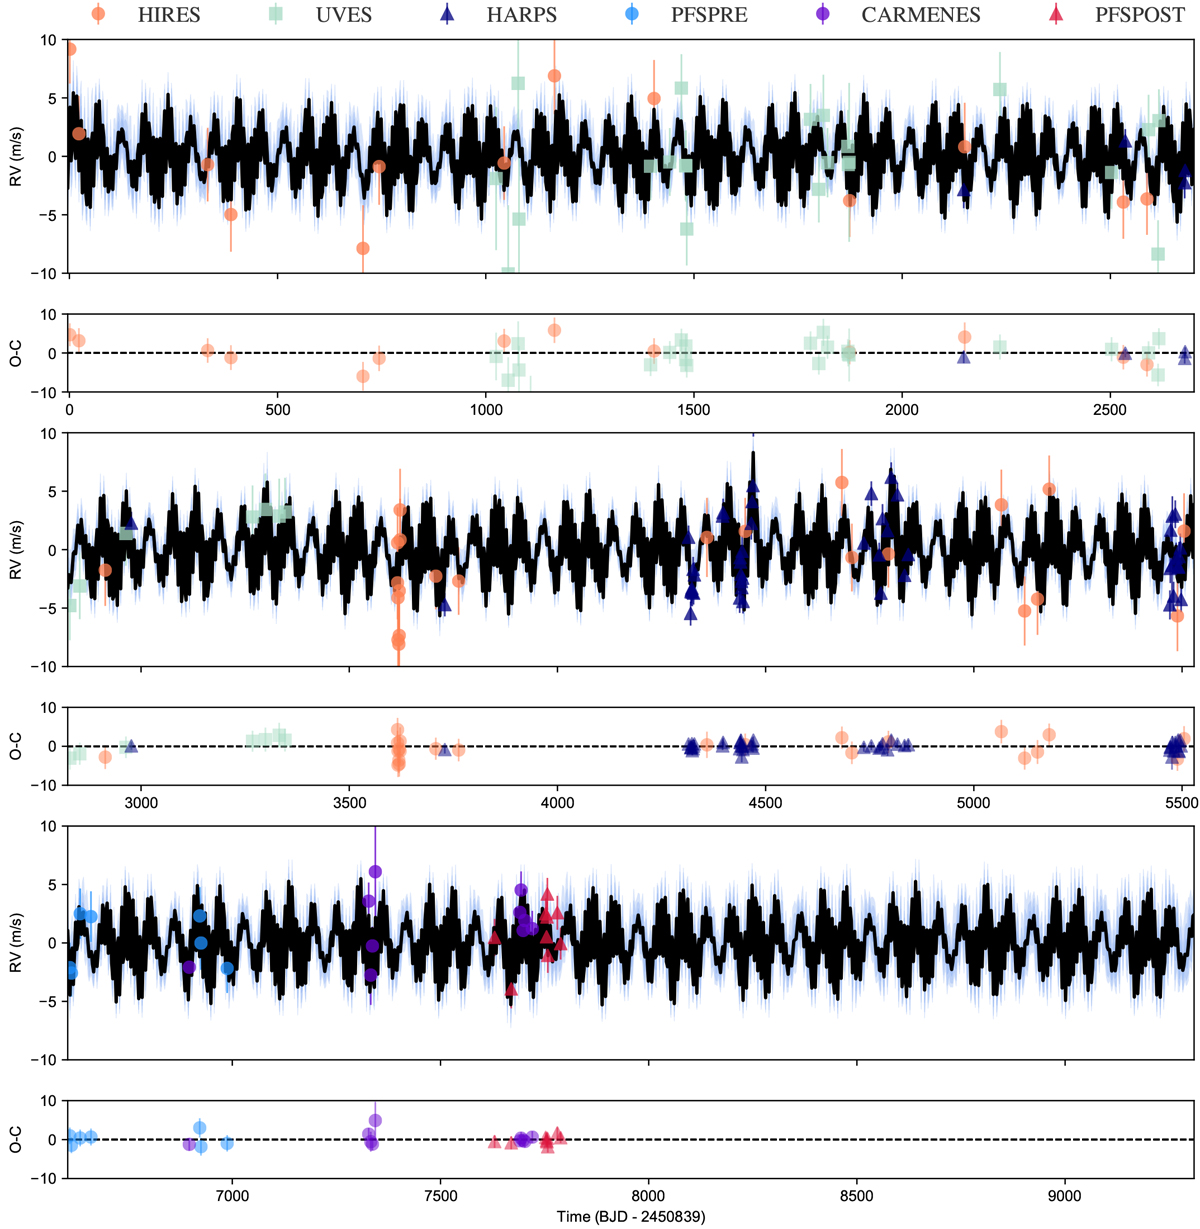
RV measurements as a function of time along with the residuals obtained from subtracting our median best joint fit model (black line) and the 68, 95, and 99% posterior bands (shown in blue). The color coding of the datapoints for each instrument is shown at the top.
Current usage metrics show cumulative count of Article Views (full-text article views including HTML views, PDF and ePub downloads, according to the available data) and Abstracts Views on Vision4Press platform.
Data correspond to usage on the plateform after 2015. The current usage metrics is available 48-96 hours after online publication and is updated daily on week days.
Initial download of the metrics may take a while.