Fig. 2.
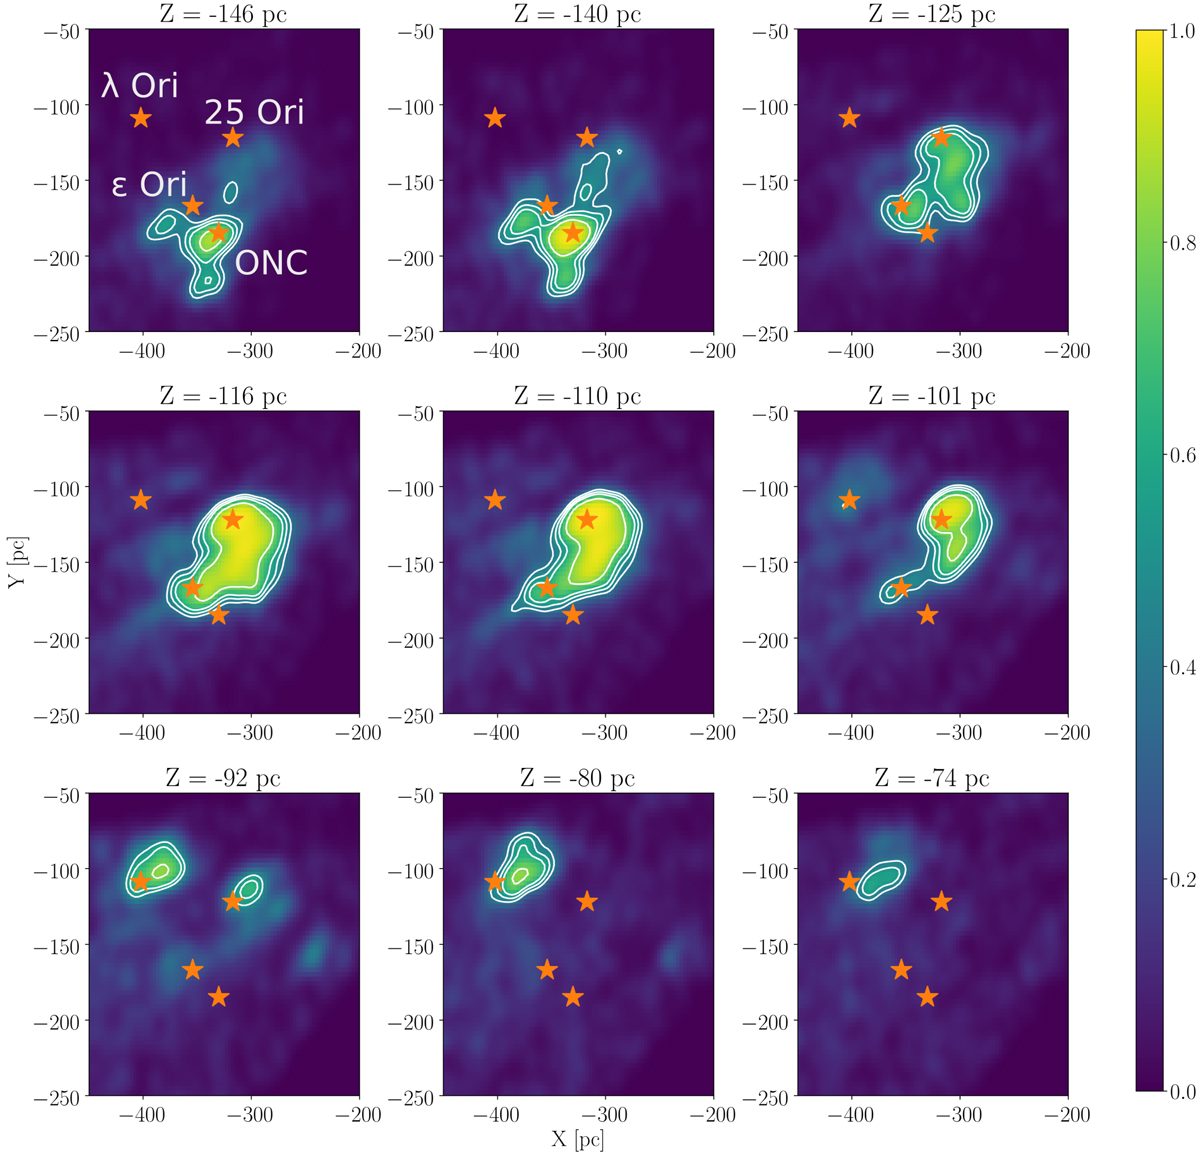
Density distribution of the sources in Orion for different Z values. The orange stars indicate the positions of (from top to bottom in each panel): λ Ori, 25 Ori, ϵ Ori, and the Orion Nebula cluster. The white solid contours represent the 0.4, 0.5, 0.6 and 0.8 density levels (the density is normalised to have values from 0 to 1). The Sun is located at (X, Y) = (0, 0).
Current usage metrics show cumulative count of Article Views (full-text article views including HTML views, PDF and ePub downloads, according to the available data) and Abstracts Views on Vision4Press platform.
Data correspond to usage on the plateform after 2015. The current usage metrics is available 48-96 hours after online publication and is updated daily on week days.
Initial download of the metrics may take a while.