Fig. 5.
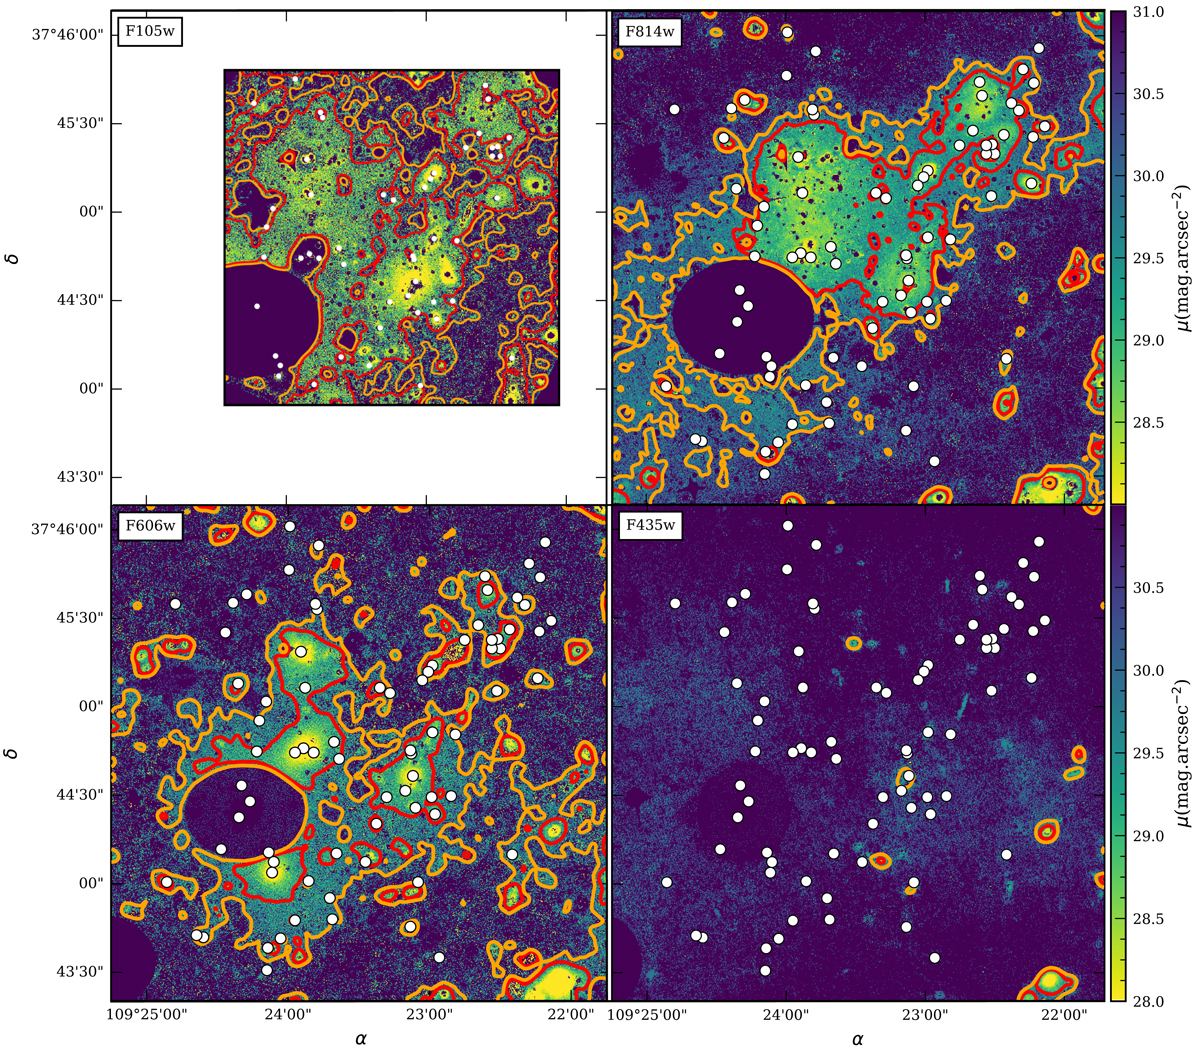
Surface brightness maps of the residuals after wavelet processing by DAWIS in each band. The orange contours show 3σbkg detection and the red ones 5σbkg. The white dots show the galaxies in the cluster redshift range (0.53 < z < 0.56). From top to bottom and left to right: F435W, F606W, F814W, and F105W. The F105W residual map is smaller as a result of the WFC3 FoV being smaller than the ACS one, and has therefore been scaled to the other ones. The contours are smoothed with a Gaussian kernel of σ = 5 for the map to be readable.
Current usage metrics show cumulative count of Article Views (full-text article views including HTML views, PDF and ePub downloads, according to the available data) and Abstracts Views on Vision4Press platform.
Data correspond to usage on the plateform after 2015. The current usage metrics is available 48-96 hours after online publication and is updated daily on week days.
Initial download of the metrics may take a while.