Fig. 6.
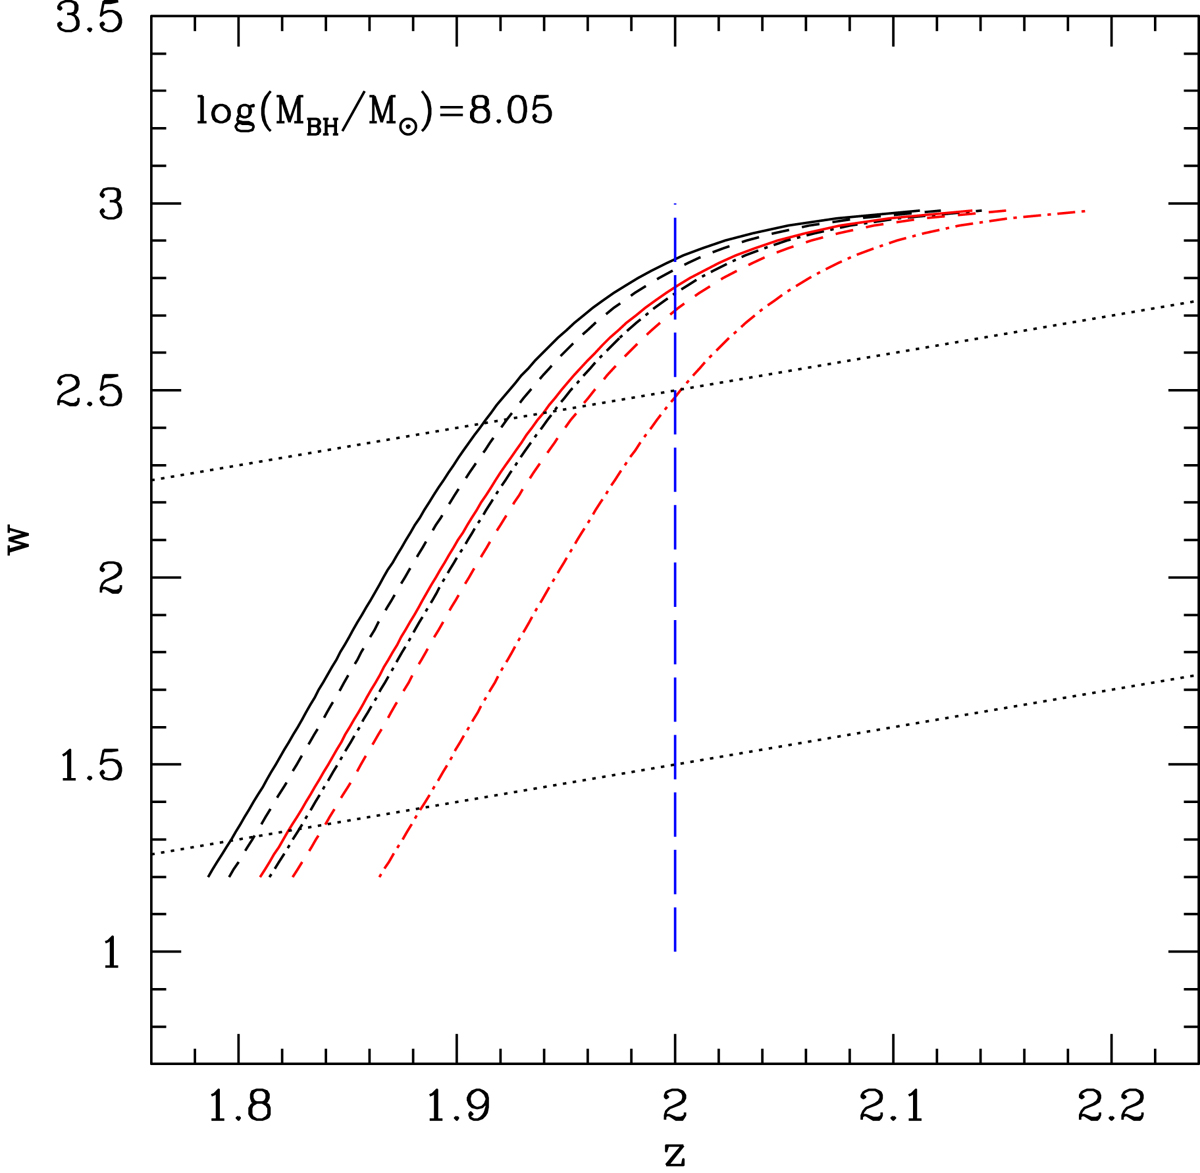
Limits for the values of parameter w as a function of z for the case log(MBH/M⊙) = 8.15. The black dotted lines show the limits defined by condition (25); the vertical blue dashed line represents z = 2.00, which is our fit value of the slope for log(ρXobs) as a function of log(MBH/M⊙) defined by Eq. (6). The curves w = w(z) are derived from condition (29) for different choices of the parameters {gex, gin} characterising the region in which eclipsing clouds are located; the various cases shown are identified by the following code: black refers to gex = 3.0, the solid line indicates gin = 0.1, the dashed line refers to gin = 0.3, dot-dashed line indicates gin = 0.8, and red refers to gex = 1.5; the gin values have same line-type code. The region of allowed values for w is between the two black dotted lines and on the right of the w(z) curve for each case.
Current usage metrics show cumulative count of Article Views (full-text article views including HTML views, PDF and ePub downloads, according to the available data) and Abstracts Views on Vision4Press platform.
Data correspond to usage on the plateform after 2015. The current usage metrics is available 48-96 hours after online publication and is updated daily on week days.
Initial download of the metrics may take a while.