Fig. 5.
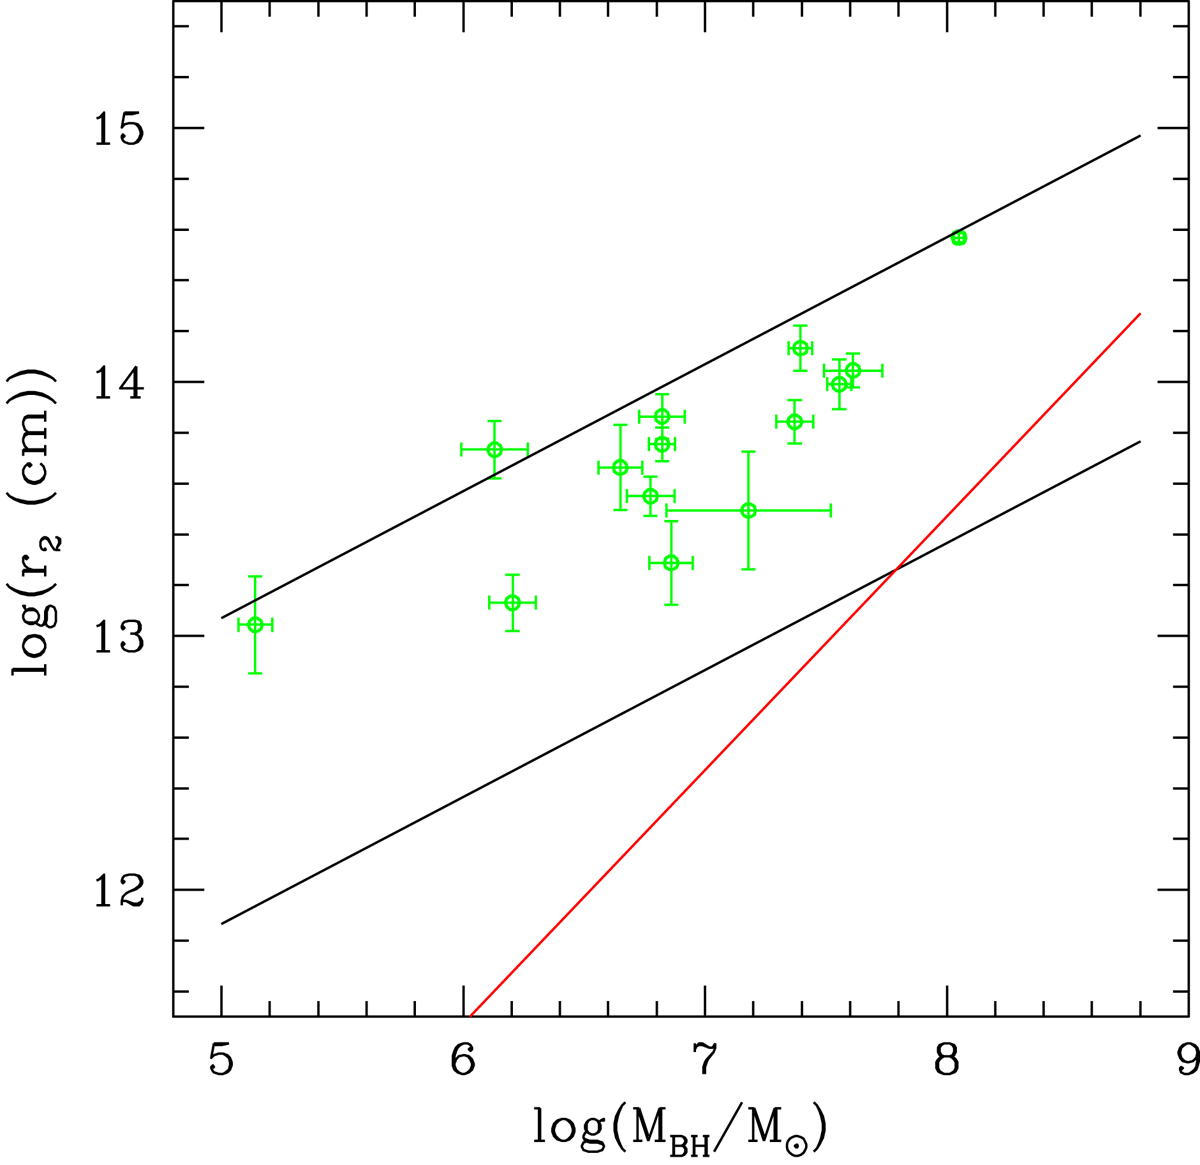
Allowed range for the upper limit for cloud size distribution, r2, is shown as a function of MBH (black lines) as derived in Eq. ( 23) for the cases w = 2.0, z = 2.00, and {gex = 3.0, gin = 0.1}. The red line shows the lower limiting condition on r2, again as a function of MBH, holding for sources in whose light curves we detected reliable X-ray eclipses and defined by Eq. (26). Green points show the values of r2 directly computed according to the procedure described in Sect. 5.1 for the sources of Table 1. See the text for details.
Current usage metrics show cumulative count of Article Views (full-text article views including HTML views, PDF and ePub downloads, according to the available data) and Abstracts Views on Vision4Press platform.
Data correspond to usage on the plateform after 2015. The current usage metrics is available 48-96 hours after online publication and is updated daily on week days.
Initial download of the metrics may take a while.