Fig. 1
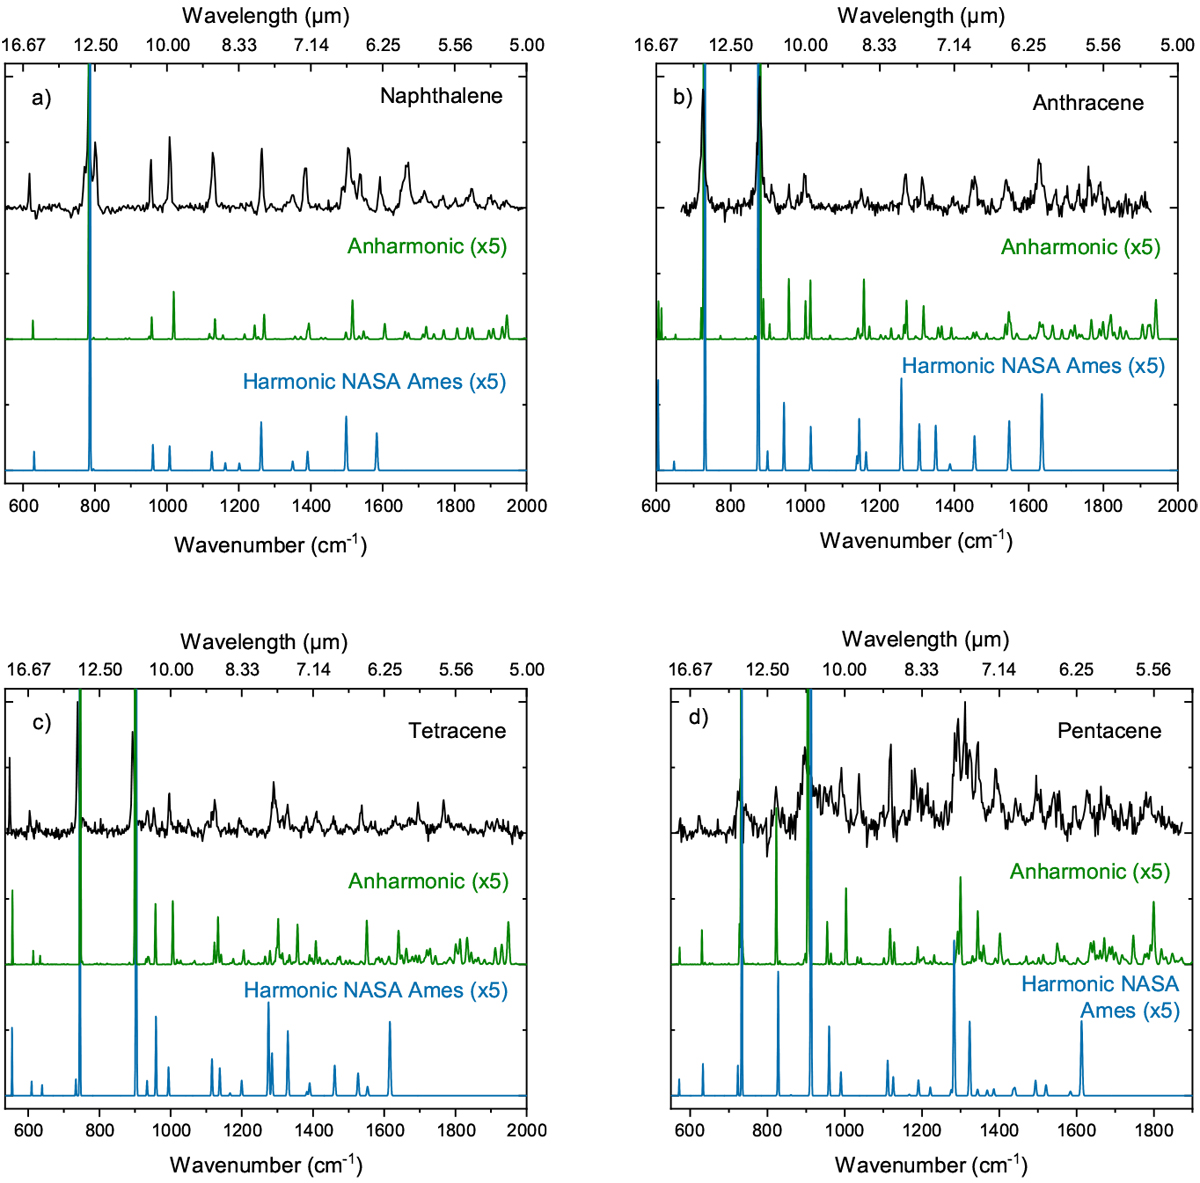
Molecular beam gas-phase IR absorption spectra of (a) naphthalene, (b) anthracene, (c) tetracene and (d) pentacene (black). Predicted IR spectra using the harmonic and anharmonic approximation are given as blueand green traces, respectively. The harmonic spectra have been obtained from the NASA Ames PAH spectral database (Bauschlicher et al. 2018). The predicted spectra are multiplied by a factor five, truncating the strongest bands to enable a better visualization of the low-intensity bands (normalized spectra can be found in the appendix).
Current usage metrics show cumulative count of Article Views (full-text article views including HTML views, PDF and ePub downloads, according to the available data) and Abstracts Views on Vision4Press platform.
Data correspond to usage on the plateform after 2015. The current usage metrics is available 48-96 hours after online publication and is updated daily on week days.
Initial download of the metrics may take a while.