Fig. 8
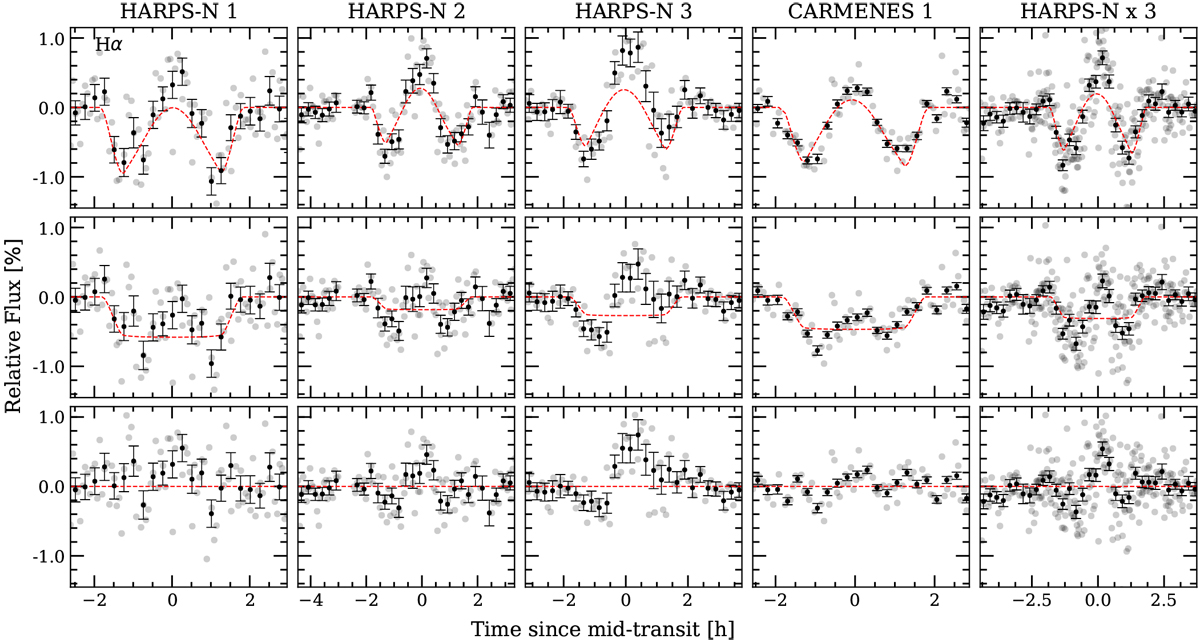
Hα transmissionlight curves for 1.5 Å bandwidth. Each column correspond to one night, and the last column (right) to the analysis of all HARPS-N nights together. First row, top: observed transmission light curves. These light curves contain the contribution of the CLV, RME and absorption of the planet. The red dashed line shows the best-fit model derived from the fitting procedure of the residuals from Fig. 5. Second row: Hα transmission light curve after removing the CLV and RME. In red we show the best-fit absorption model. Third row: residuals between the model and the data. In all cases the grey dots are the original data points, in black we show the data binned by 0.003 orbital phase. We note the different x-scale of the different columns, as different nights present different time extension.
Current usage metrics show cumulative count of Article Views (full-text article views including HTML views, PDF and ePub downloads, according to the available data) and Abstracts Views on Vision4Press platform.
Data correspond to usage on the plateform after 2015. The current usage metrics is available 48-96 hours after online publication and is updated daily on week days.
Initial download of the metrics may take a while.