Fig. 5
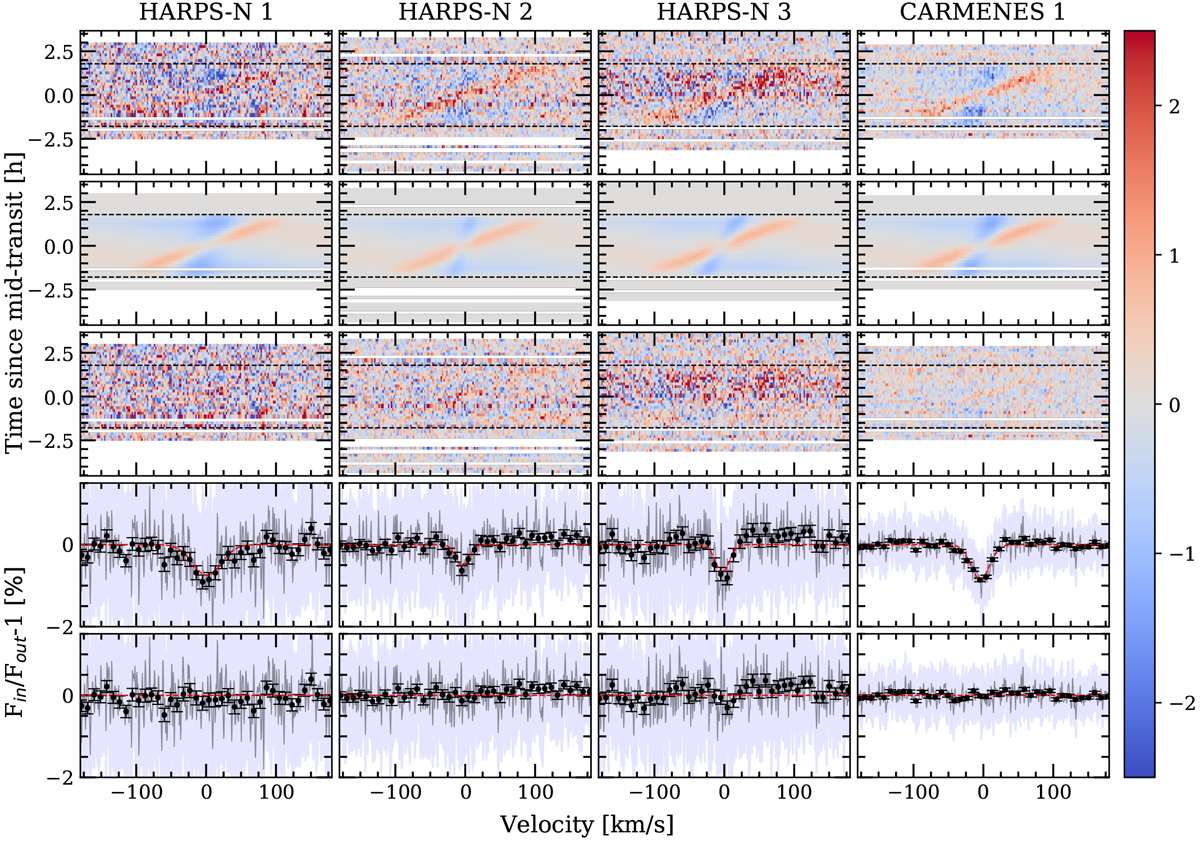
Results of the Hα line analysis of MASCARA-2b. Each column corresponds to one night. First row,top: residuals after dividing each spectrum by the master-out spectrum. Second row: best-fit model describing the first panel residuals, including absorption, CLV and RME. Third row: residuals after subtracting the best-fit model (second row) to the data (first row). Fourth row: transmission spectrum obtained when combining the in-transit residuals from fourth row in the planetary rest frame. The black dots show the transmission spectrum binned in 0.2 Å intervals and the propagated errors from the photon noise. Light blue shows the standard deviation of the residuals from fourth row. The red lines show the Gaussian profile derived from the best-fit parameters of second row. Fifth row: residuals after subtracting the Gaussian profile to the transmission spectrum. In all cases the residuals (rows from 1st to 3rd) are binned in intervals of 0.002 in orbital phase and 0.05 Å in wavelength. The relative flux (Fin /Fout −1) in % is shown in the colour bar. In white we show the time regions for which we have no information. The horizontal lines show the first and last contact times of the transit.
Current usage metrics show cumulative count of Article Views (full-text article views including HTML views, PDF and ePub downloads, according to the available data) and Abstracts Views on Vision4Press platform.
Data correspond to usage on the plateform after 2015. The current usage metrics is available 48-96 hours after online publication and is updated daily on week days.
Initial download of the metrics may take a while.