Fig. 4
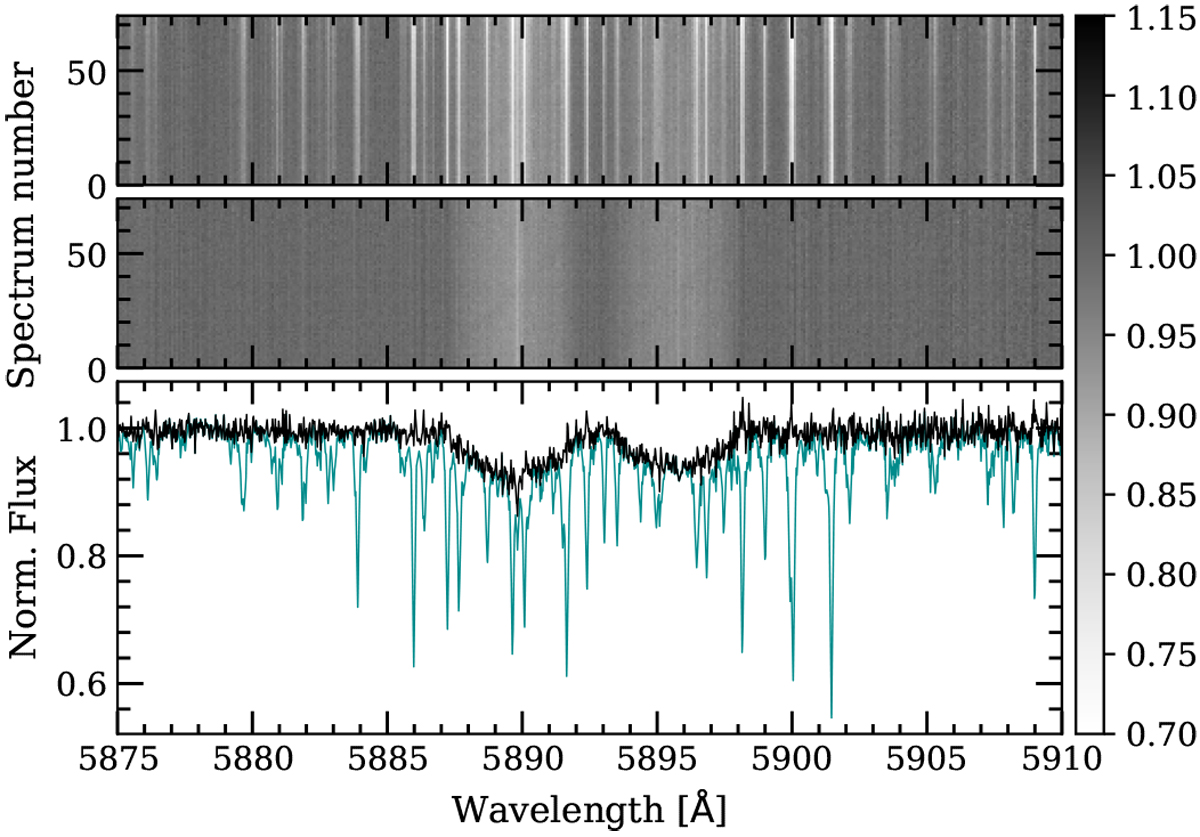
Telluric correction of CARMENES observations (Night 4) of MASCARA-2b in the NaI doublet region. Top panel: observed spectra before the telluric correction; second panel: spectra after correcting the telluric contamination with Molecfit. For these two panels the y-axis corresponds to the spectrum number, the x-axis to wavelength in Å, and the normalised flux is shown in the colour bar. Third panel: one single spectrum before (blue) and after (black) the telluric correction. The narrow lines observed in the first and third panels are telluric lines, while the broad lines centred at 5890 and 5896 Å are the stellar sodium lines. In the second panel, where the telluric lines have been subtracted, we observe the interstellar sodium in the centre of the stellar lines and, additionally, the planetary shadow (Rossiter–McLaughlin effect) as a trail moving into the lines. The spectra are presented in the terrestrial rest frame.
Current usage metrics show cumulative count of Article Views (full-text article views including HTML views, PDF and ePub downloads, according to the available data) and Abstracts Views on Vision4Press platform.
Data correspond to usage on the plateform after 2015. The current usage metrics is available 48-96 hours after online publication and is updated daily on week days.
Initial download of the metrics may take a while.