Fig. E.1
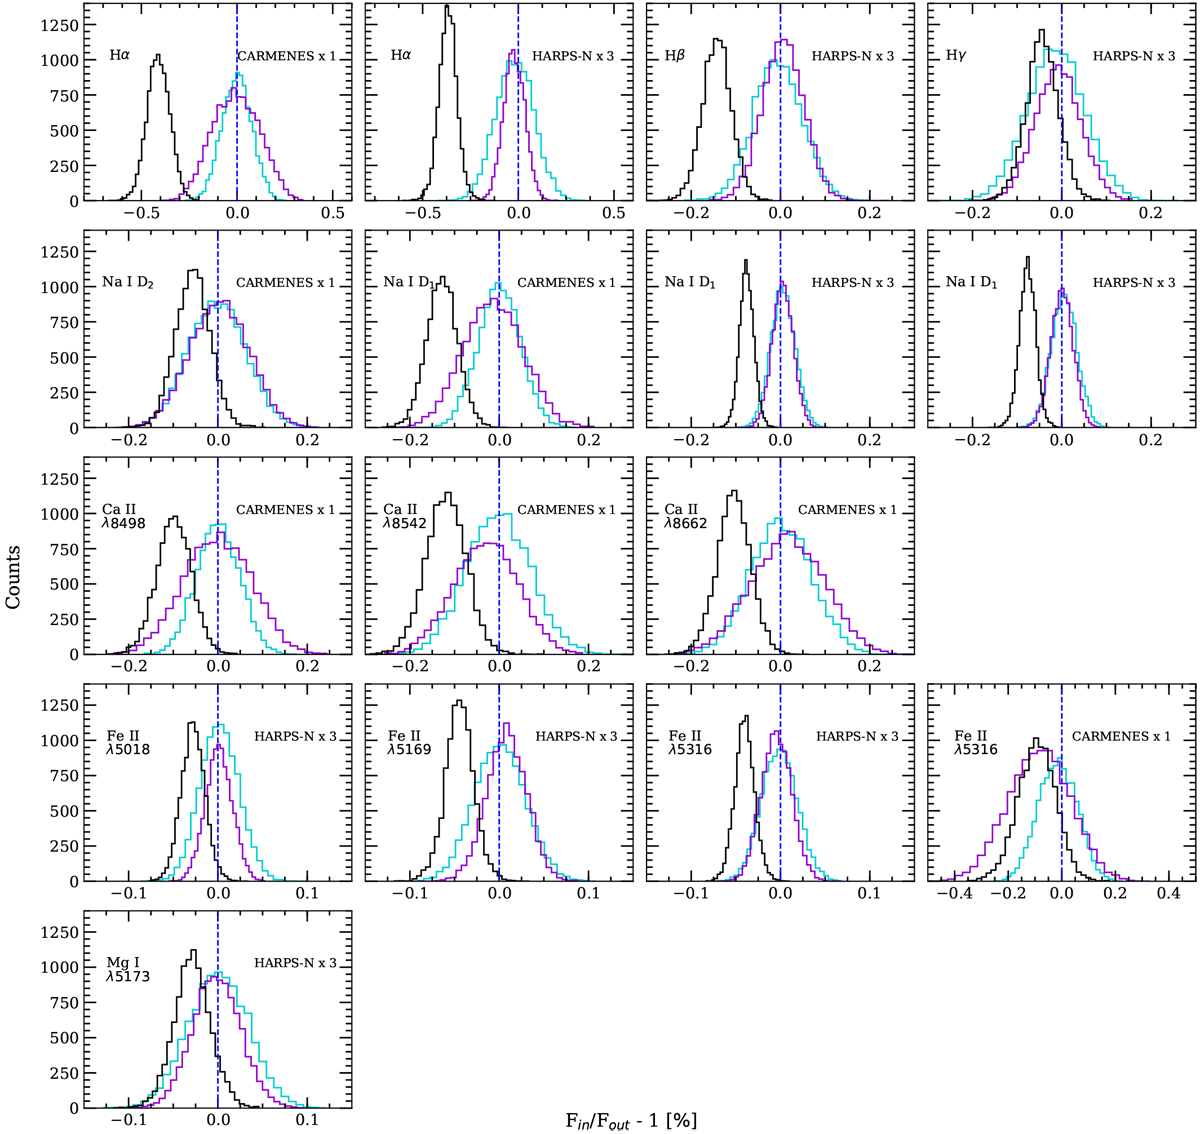
Distributions of the empirical Monte-Carlo analysis of the different lines, for a 1.5 Å passband. Each individual panel corresponds to the analysis of one line and one instrument, which are detailed in text. In violet wepresent the “out–out” scenario, in cyan the “in–in” scenario and in black the “in–out” scenario. The blue dashed vertical line shows the null absorption level. The CARMENES and HARPS-N analysis have different number of spectra, which means that the distributions will have different number of counts. This is also the case for the three scenarios in which the number of spectra considered is also different.
Current usage metrics show cumulative count of Article Views (full-text article views including HTML views, PDF and ePub downloads, according to the available data) and Abstracts Views on Vision4Press platform.
Data correspond to usage on the plateform after 2015. The current usage metrics is available 48-96 hours after online publication and is updated daily on week days.
Initial download of the metrics may take a while.