Fig. 3
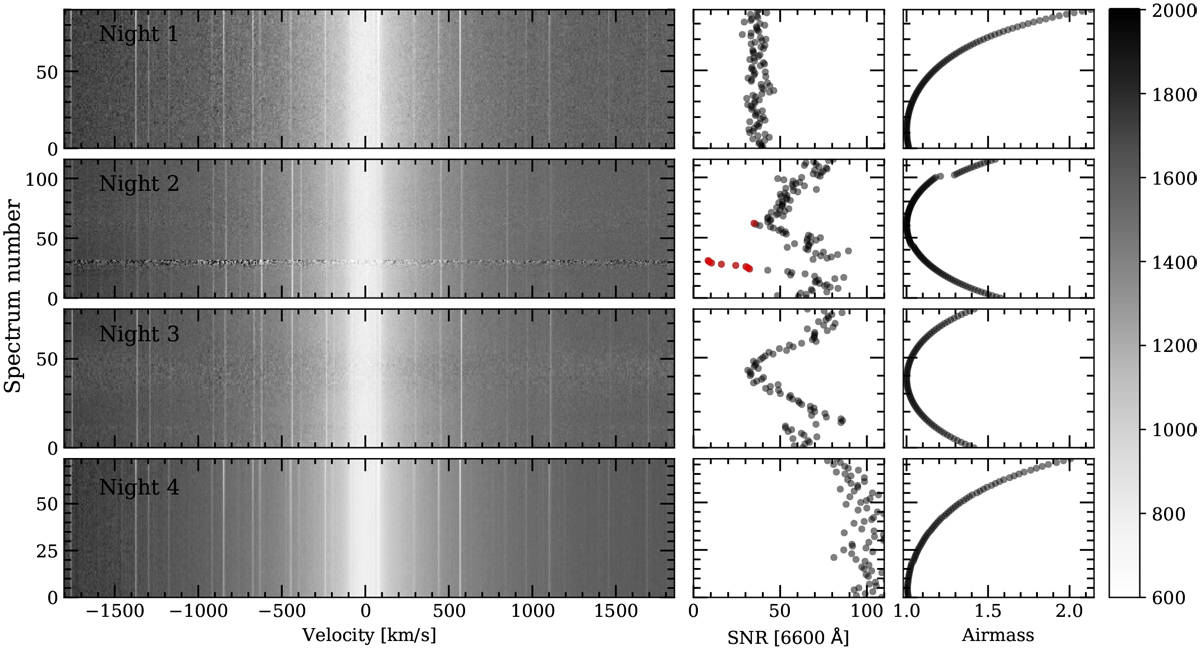
Observed spectra around the Hα line (left column), for Night 1 (first row), Night 2 (second row), Night 3 (third row) and Night 4 (fourth row). The three first nights were observed with HARPS-N and the last night, with CARMENES. The spectra are normalised to the same continuum level (see colour bar) and moved to the stellar rest frame. In the y-axis we show the spectrum number starting from zero and in the x-axis the velocity in km s−1. The narrow lines correspond to telluric contamination and the deepest central line (at 0 km s −1) corresponds to the centre of the Hα line core. Second and third columns: S/N and the airmass variation during the night, respectively. The S/N per pixel is extracted in the continuum near the Hα line, specifically around 6600 Å as the Hα line for this target is very broad due to its rapid rotation. The red S/N values correspond to the spectra which are not considered in our analysis. In particular, we observe a stable S/N during Night 1. Night 2 shows a drop in the S/N for the presence of a cloud around spectrum number 25 and two stops of the instrument around spectrum number 50 and 100 because GIANO-B suddenly aborted itself and it was necessary to restart the exposure with both the HARPS-N and GIANO-B instruments.
Current usage metrics show cumulative count of Article Views (full-text article views including HTML views, PDF and ePub downloads, according to the available data) and Abstracts Views on Vision4Press platform.
Data correspond to usage on the plateform after 2015. The current usage metrics is available 48-96 hours after online publication and is updated daily on week days.
Initial download of the metrics may take a while.