Fig. C.5
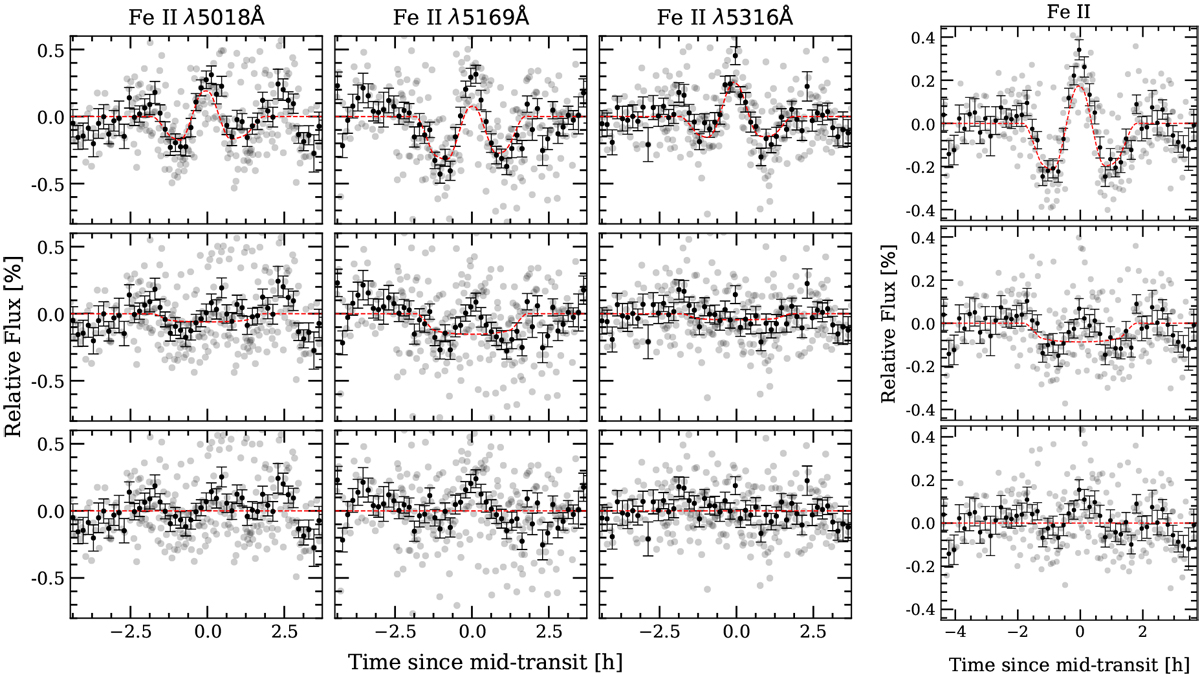
FeII transmission light curves obtained combining the three nights of HARPS-N data. Left: as Fig. C.3 but for three individual FeII lines and using a 0.75 Å passband. We note the asymmetry of the observed transmission light curve (first row) of the FeIIλ5169 line, caused by the RM effect from the closest line crossing the position of the FeII for times close to the egress. Right: transmission light curve after combining the three individual FeII lines. The data is binned by 0.002 in orbital phase.
Current usage metrics show cumulative count of Article Views (full-text article views including HTML views, PDF and ePub downloads, according to the available data) and Abstracts Views on Vision4Press platform.
Data correspond to usage on the plateform after 2015. The current usage metrics is available 48-96 hours after online publication and is updated daily on week days.
Initial download of the metrics may take a while.