Fig. C.4
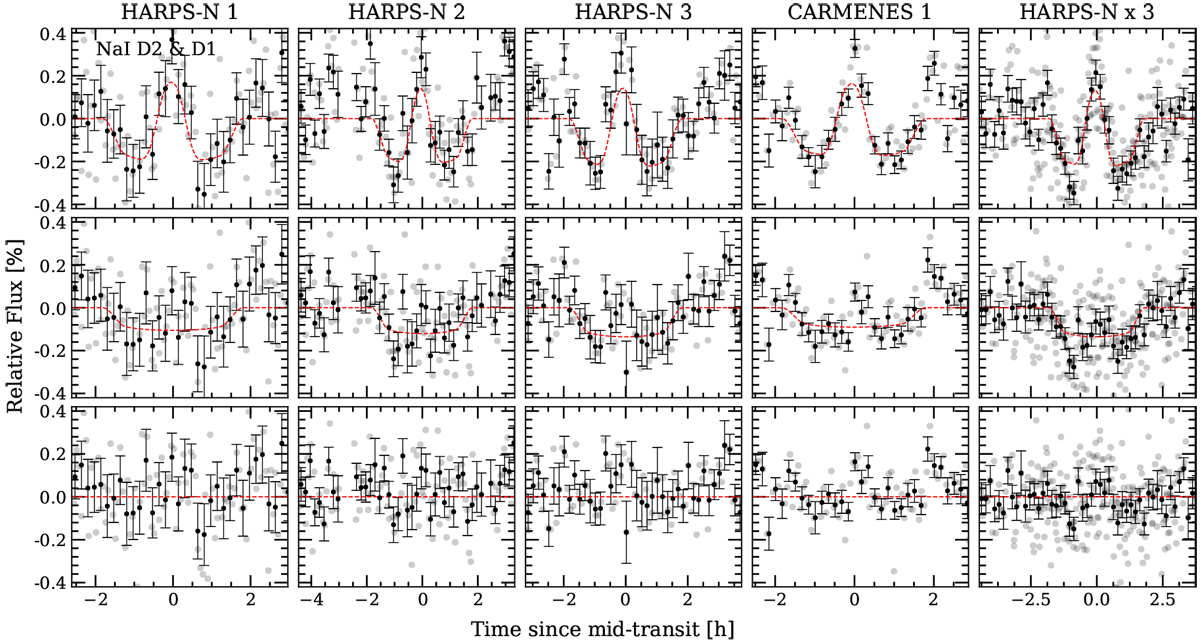
As Fig. C.1 but for both NaI D2 and D1 lines. This is the result of computing the weighted mean of both individual NaI D lines transmission light curves for a 0.75 Å passband. Data binned 0.002 in orbital phase.
Current usage metrics show cumulative count of Article Views (full-text article views including HTML views, PDF and ePub downloads, according to the available data) and Abstracts Views on Vision4Press platform.
Data correspond to usage on the plateform after 2015. The current usage metrics is available 48-96 hours after online publication and is updated daily on week days.
Initial download of the metrics may take a while.