Fig. C.3
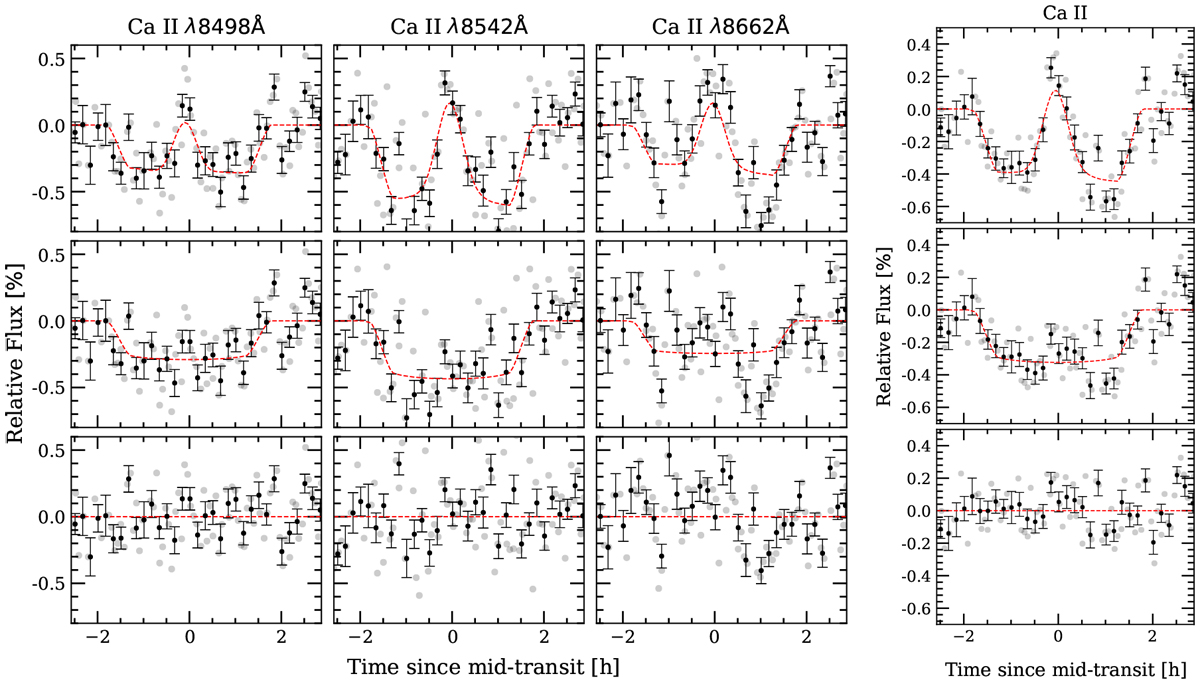
CaII transmission light curves obtained with CARMENES data. Left: as Fig. C.1 but for the CaII triplet lines. The analysis of each line is shown in one column. Right: combined light curve (using the weighted mean) of the three individual light curves of CaII triplet lines observed in the left panel. These are the results for a 0.75 Å passband analysis. Data binned 0.002 in orbital phase.
Current usage metrics show cumulative count of Article Views (full-text article views including HTML views, PDF and ePub downloads, according to the available data) and Abstracts Views on Vision4Press platform.
Data correspond to usage on the plateform after 2015. The current usage metrics is available 48-96 hours after online publication and is updated daily on week days.
Initial download of the metrics may take a while.