Fig. C.1
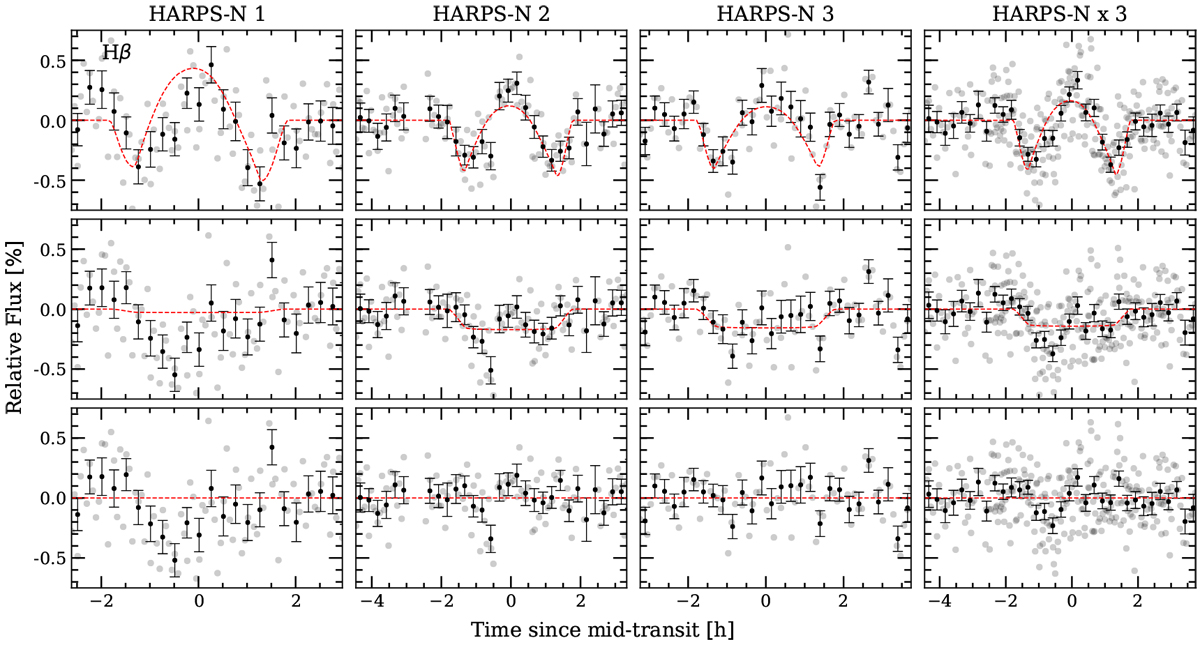
Hβ transmission light curves of HARPS-N Night 1 (first column, left), Night 2 (second column), Night 3 (third column) and join analysis of all HARPS-N observations (fourth column, right) computed for 1.5 Å passband. First row, top: observed transmission light curve. Second row: after correcting for theCLV and RME. Third row, bottom: residuals when subtracting the model to the data. The grey dots are the original data, the black dots is the data binned 0.003 in orbital phase. The red dashed line of the first row is the best-fit model containing the CLV, RME and absorption. The red dashed line of the second row corresponds to the model containing only absorption. In the third row, the red line is a reference showing the null flux level.
Current usage metrics show cumulative count of Article Views (full-text article views including HTML views, PDF and ePub downloads, according to the available data) and Abstracts Views on Vision4Press platform.
Data correspond to usage on the plateform after 2015. The current usage metrics is available 48-96 hours after online publication and is updated daily on week days.
Initial download of the metrics may take a while.