Fig. A.3
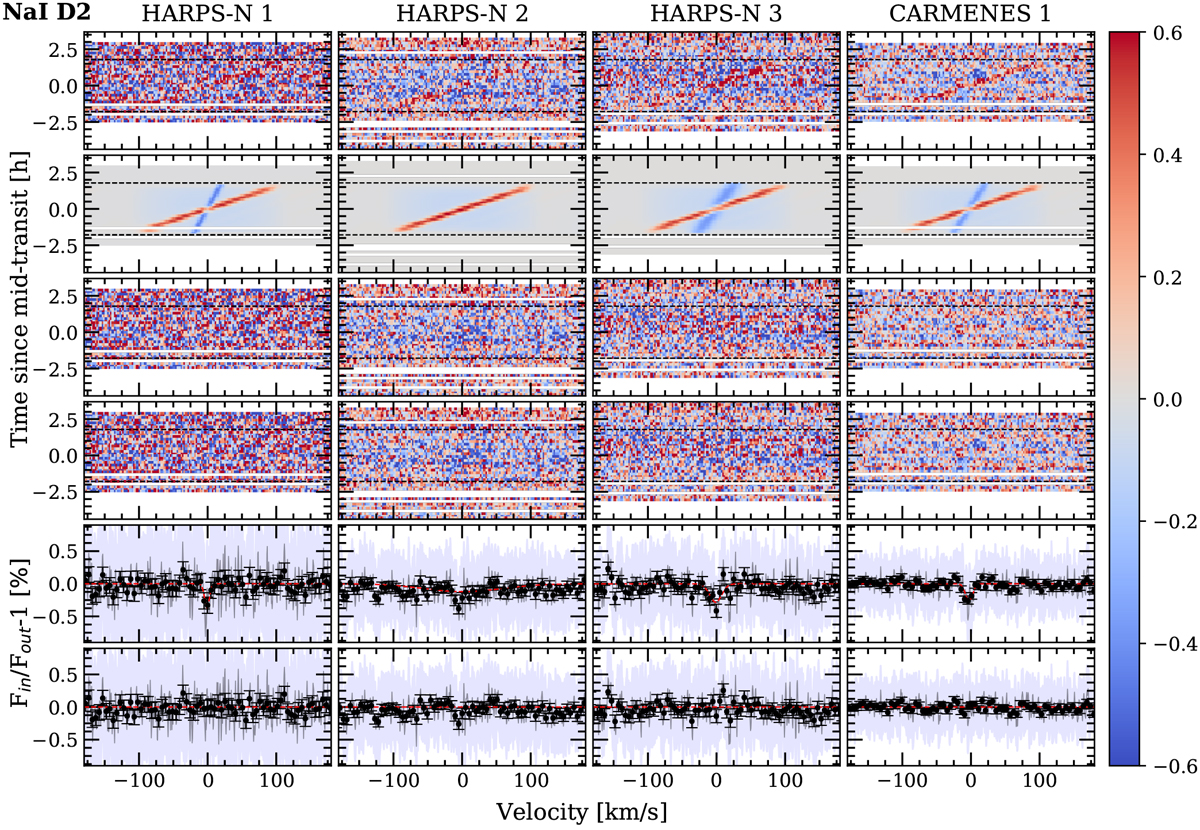
Results around the NaI D2 of HARPS-N Night 1 (first column starting from left), Night 2 (second column), Night 3 (third column) and CARMENES data (fourth column). The different panels are explained in Fig. A.1. In the last two rows (starting from top) in black dots we show the result binned by 0.1 Å.
Current usage metrics show cumulative count of Article Views (full-text article views including HTML views, PDF and ePub downloads, according to the available data) and Abstracts Views on Vision4Press platform.
Data correspond to usage on the plateform after 2015. The current usage metrics is available 48-96 hours after online publication and is updated daily on week days.
Initial download of the metrics may take a while.