Fig. A.1
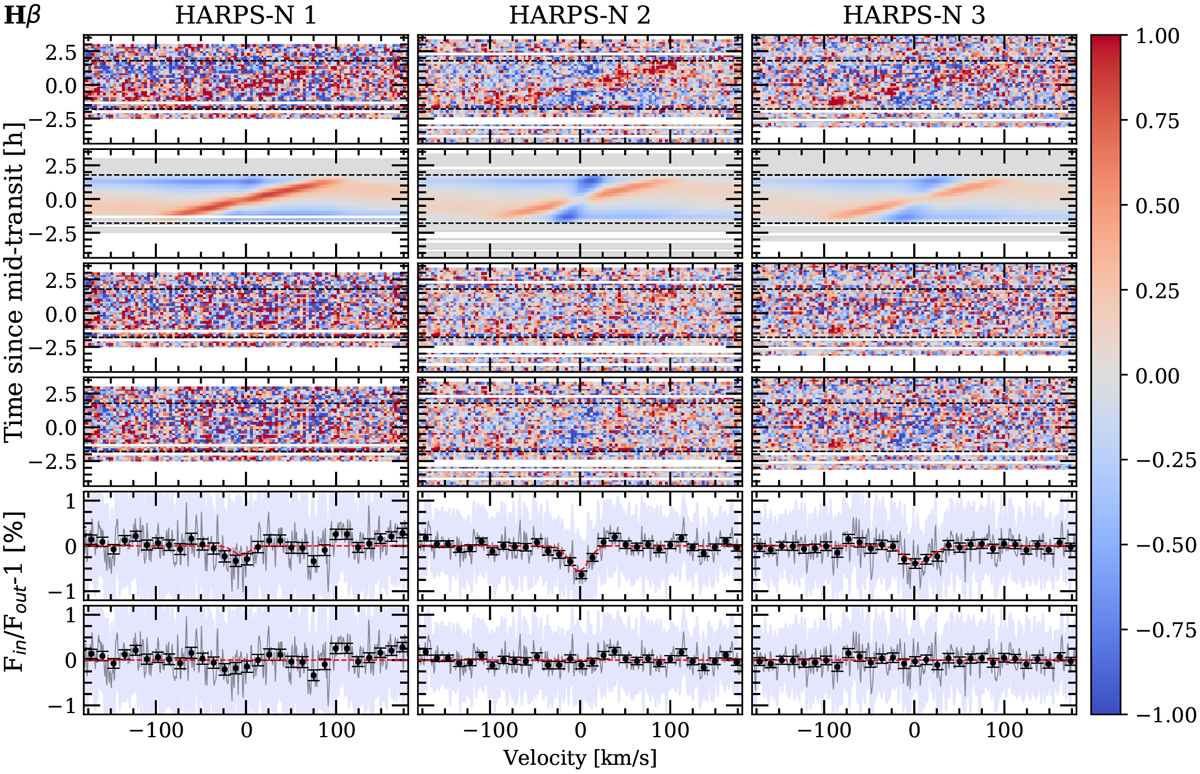
Results around the Hβ of Night 1 (left column), Night 2 (middle column), and Night 3 (right column). First row (top): results after dividing each spectrum by the out-of-transit master spectrum. Second row: best-fit model of the residuals. The RME is observed in red colour (see colour bar) and the absorption and CLV in blue (negative relative flux). Third row: residuals when subtracting the best-fit model (second row) to the data (first row). Fourth row: absorption signature remaining after correcting the CLV and RME effects from first row residuals. Fifth row: transmission spectrum. Sixth row: residuals of removing the Gaussian profile model to the data in fourth row. Black dots show the result binned by 0.2 Å, the light blue region is the standard deviation of the residuals and the red line is the Gaussian computed with the best-fit parameters. In all panels, except for the last two rows, the data is shown with 0.05 Å bins in wavelength and 0.002 in orbital phase.
Current usage metrics show cumulative count of Article Views (full-text article views including HTML views, PDF and ePub downloads, according to the available data) and Abstracts Views on Vision4Press platform.
Data correspond to usage on the plateform after 2015. The current usage metrics is available 48-96 hours after online publication and is updated daily on week days.
Initial download of the metrics may take a while.