Fig. 12
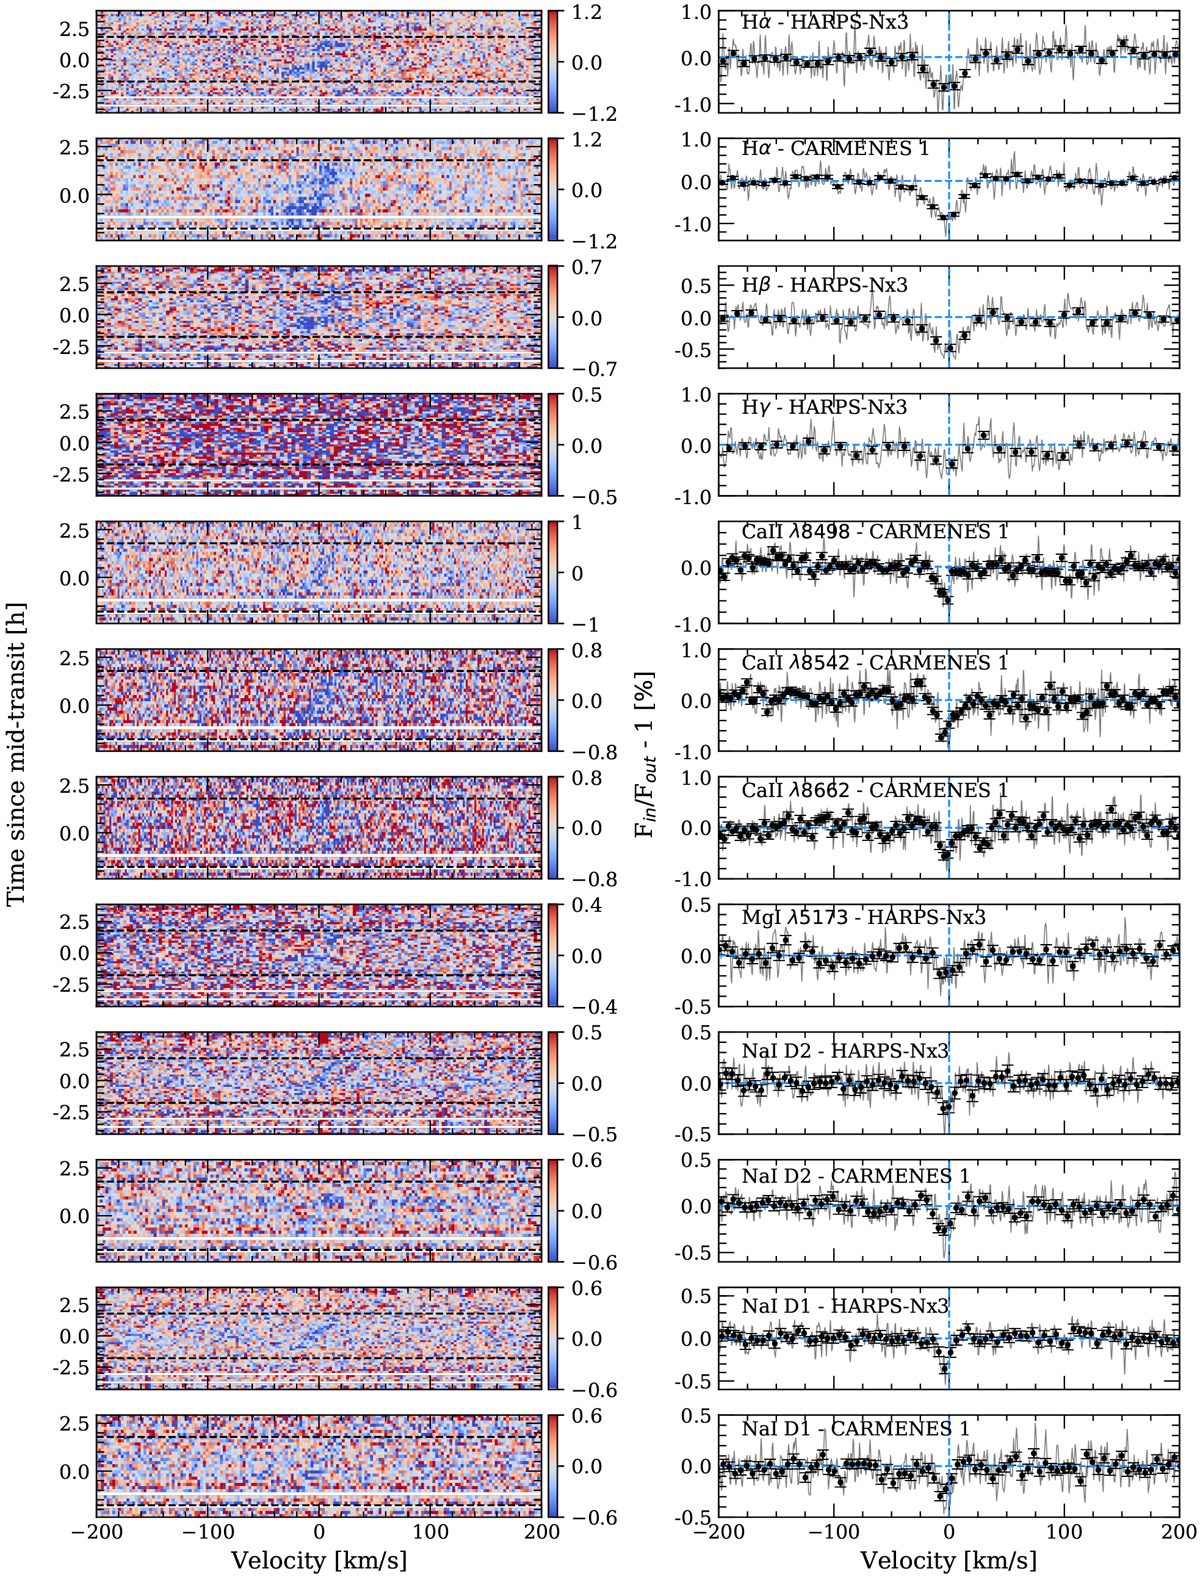
Summary of the 2D maps with the remaining absorption after the CLV and RM correction (left column) and final transmission spectra (right column) of all species analysed. Each row corresponds to one line, whose name is indicated inside each transmission spectrum figure. The residual maps data is presented binned by 0.05 Å and 0.002 in orbital phase in order to have better contrast. The transmission spectrum of Balmer lines are shown binned by 0.2 Å and the remaining lines by 0.1 Å (black dots). The colour bar indicates the flux relative to the continuum (Fin /Fout −1) in %.
Current usage metrics show cumulative count of Article Views (full-text article views including HTML views, PDF and ePub downloads, according to the available data) and Abstracts Views on Vision4Press platform.
Data correspond to usage on the plateform after 2015. The current usage metrics is available 48-96 hours after online publication and is updated daily on week days.
Initial download of the metrics may take a while.