Fig. 10
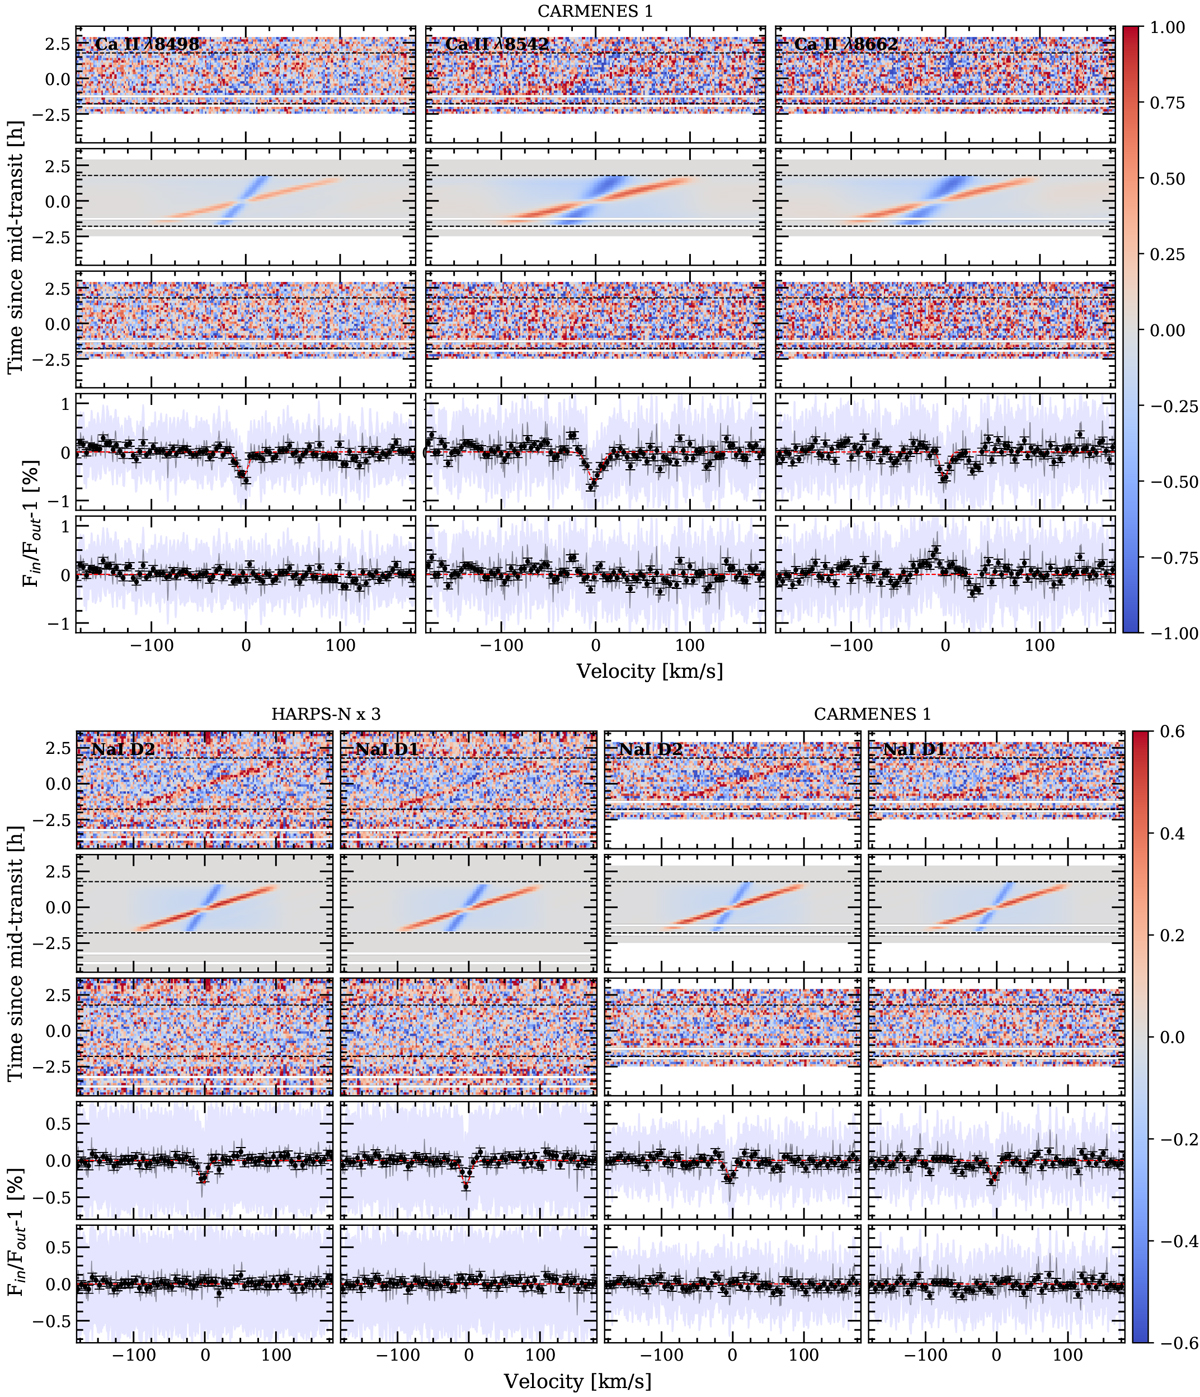
As Fig. 5, but for CaII (top) and NaI lines (bottom). The name of the line is indicated in each top-left panel and the titles indicate the instrument used to retrieve the data. The transmission spectra are binned by 0.1 Å (black dots). The colour bar indicates the flux relative to the continuum (Fin /Fout −1) in %.
Current usage metrics show cumulative count of Article Views (full-text article views including HTML views, PDF and ePub downloads, according to the available data) and Abstracts Views on Vision4Press platform.
Data correspond to usage on the plateform after 2015. The current usage metrics is available 48-96 hours after online publication and is updated daily on week days.
Initial download of the metrics may take a while.