Fig. 4.
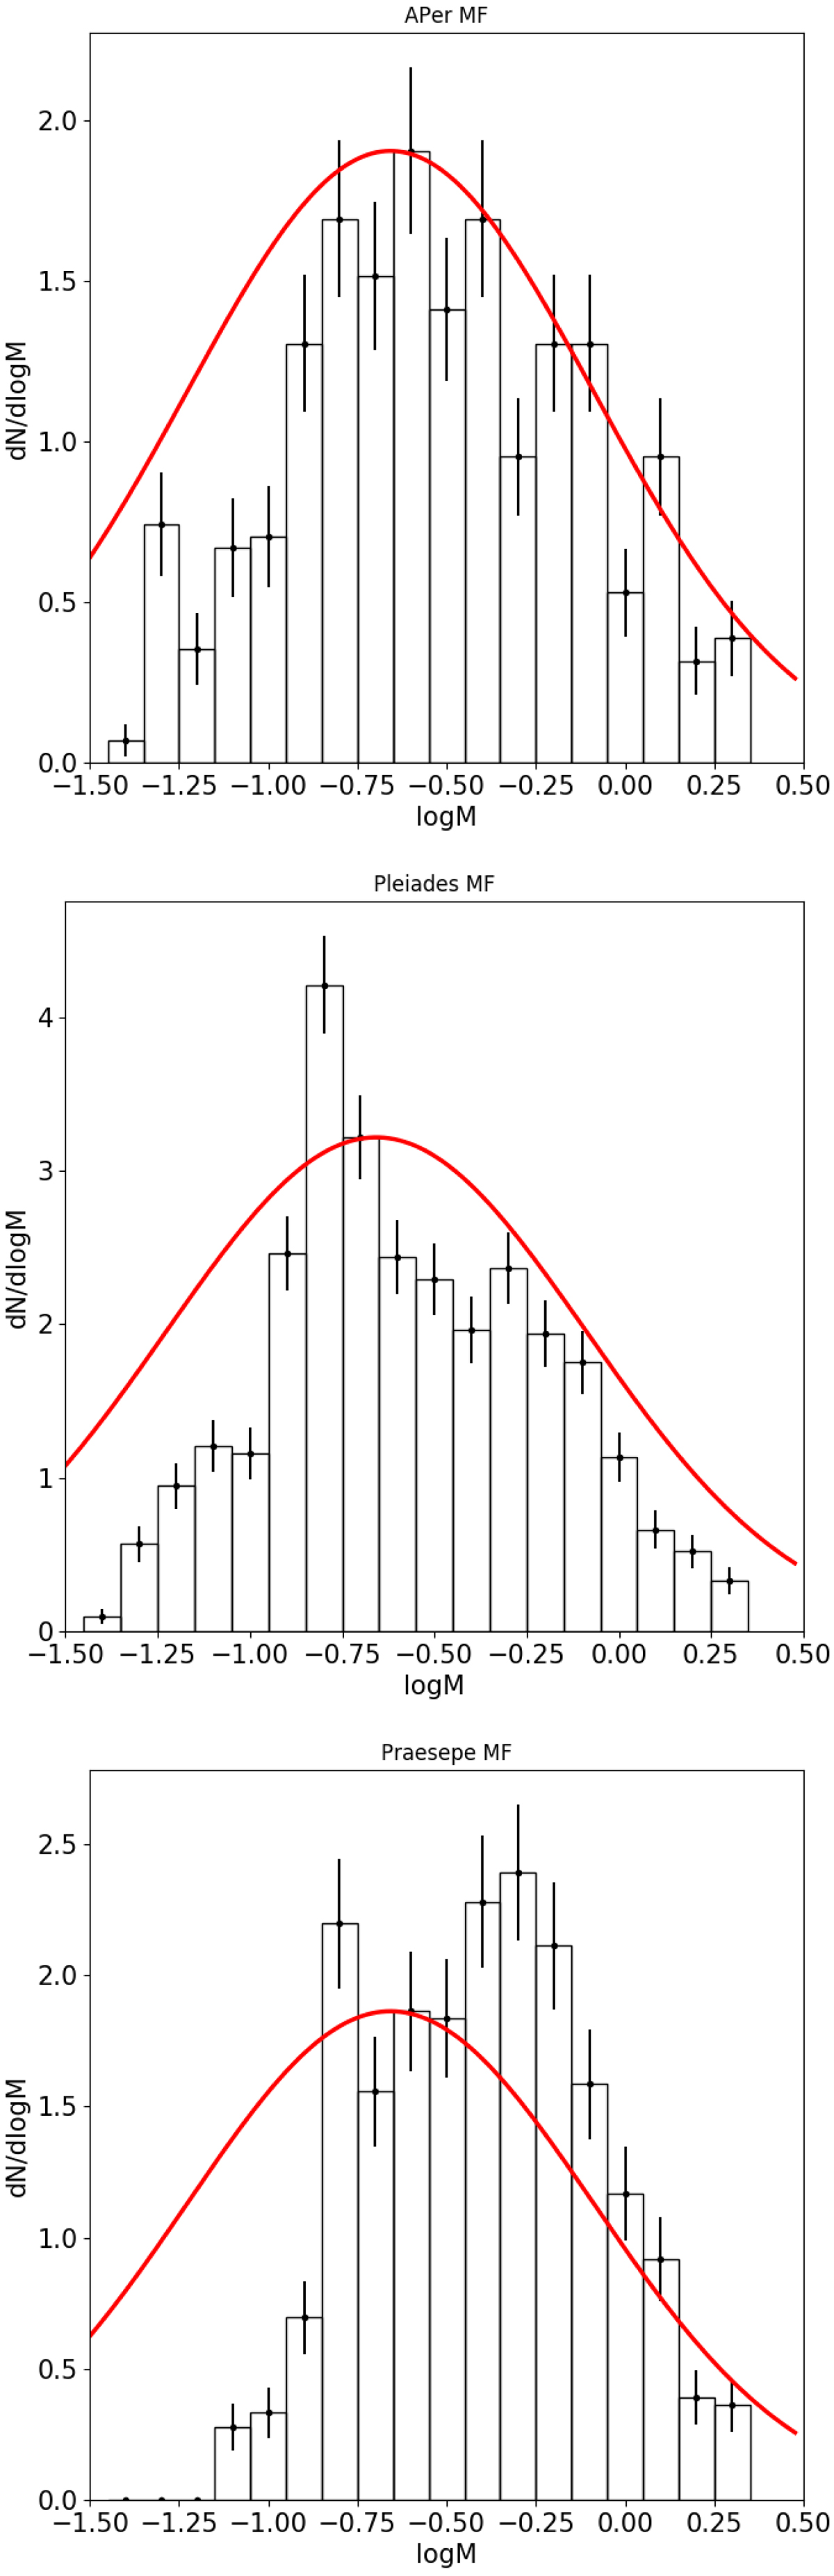
Mass functions of the α Per (bottom), Pleiades (middle), and Praesepe (top) clusters scaled to a volume of one cubic parsec and a logMass bin of 0.1 using isochrones of 90 Myr, 125 Myr, and 600 Myr, respectively. Error bars represent the Poisson noise. The field mass function from Chabrier (2003) is overplotted as a thick red line and normalised to the maximum value of the observed mass function at ∼0.25 M⊙.
Current usage metrics show cumulative count of Article Views (full-text article views including HTML views, PDF and ePub downloads, according to the available data) and Abstracts Views on Vision4Press platform.
Data correspond to usage on the plateform after 2015. The current usage metrics is available 48-96 hours after online publication and is updated daily on week days.
Initial download of the metrics may take a while.