Free Access
Fig. 1
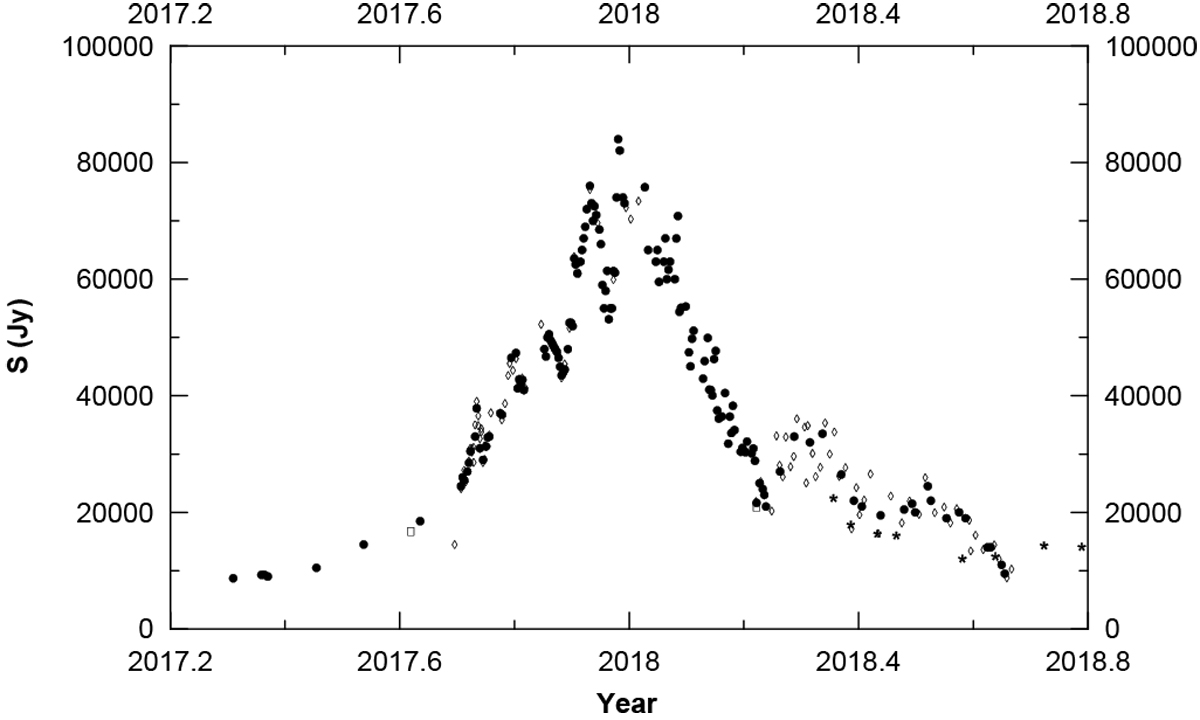
Time-series plot of the flux density of the ~+6 km s−1 water maserfeature associated with W49N. Circles denote the RT-22 Simeiz data, diamonds represent the RT-32 Torun data, squares represent the RT-100 Effelsberg data, and stars represent the RT-32 Medicina data.
Current usage metrics show cumulative count of Article Views (full-text article views including HTML views, PDF and ePub downloads, according to the available data) and Abstracts Views on Vision4Press platform.
Data correspond to usage on the plateform after 2015. The current usage metrics is available 48-96 hours after online publication and is updated daily on week days.
Initial download of the metrics may take a while.