Fig. 9.
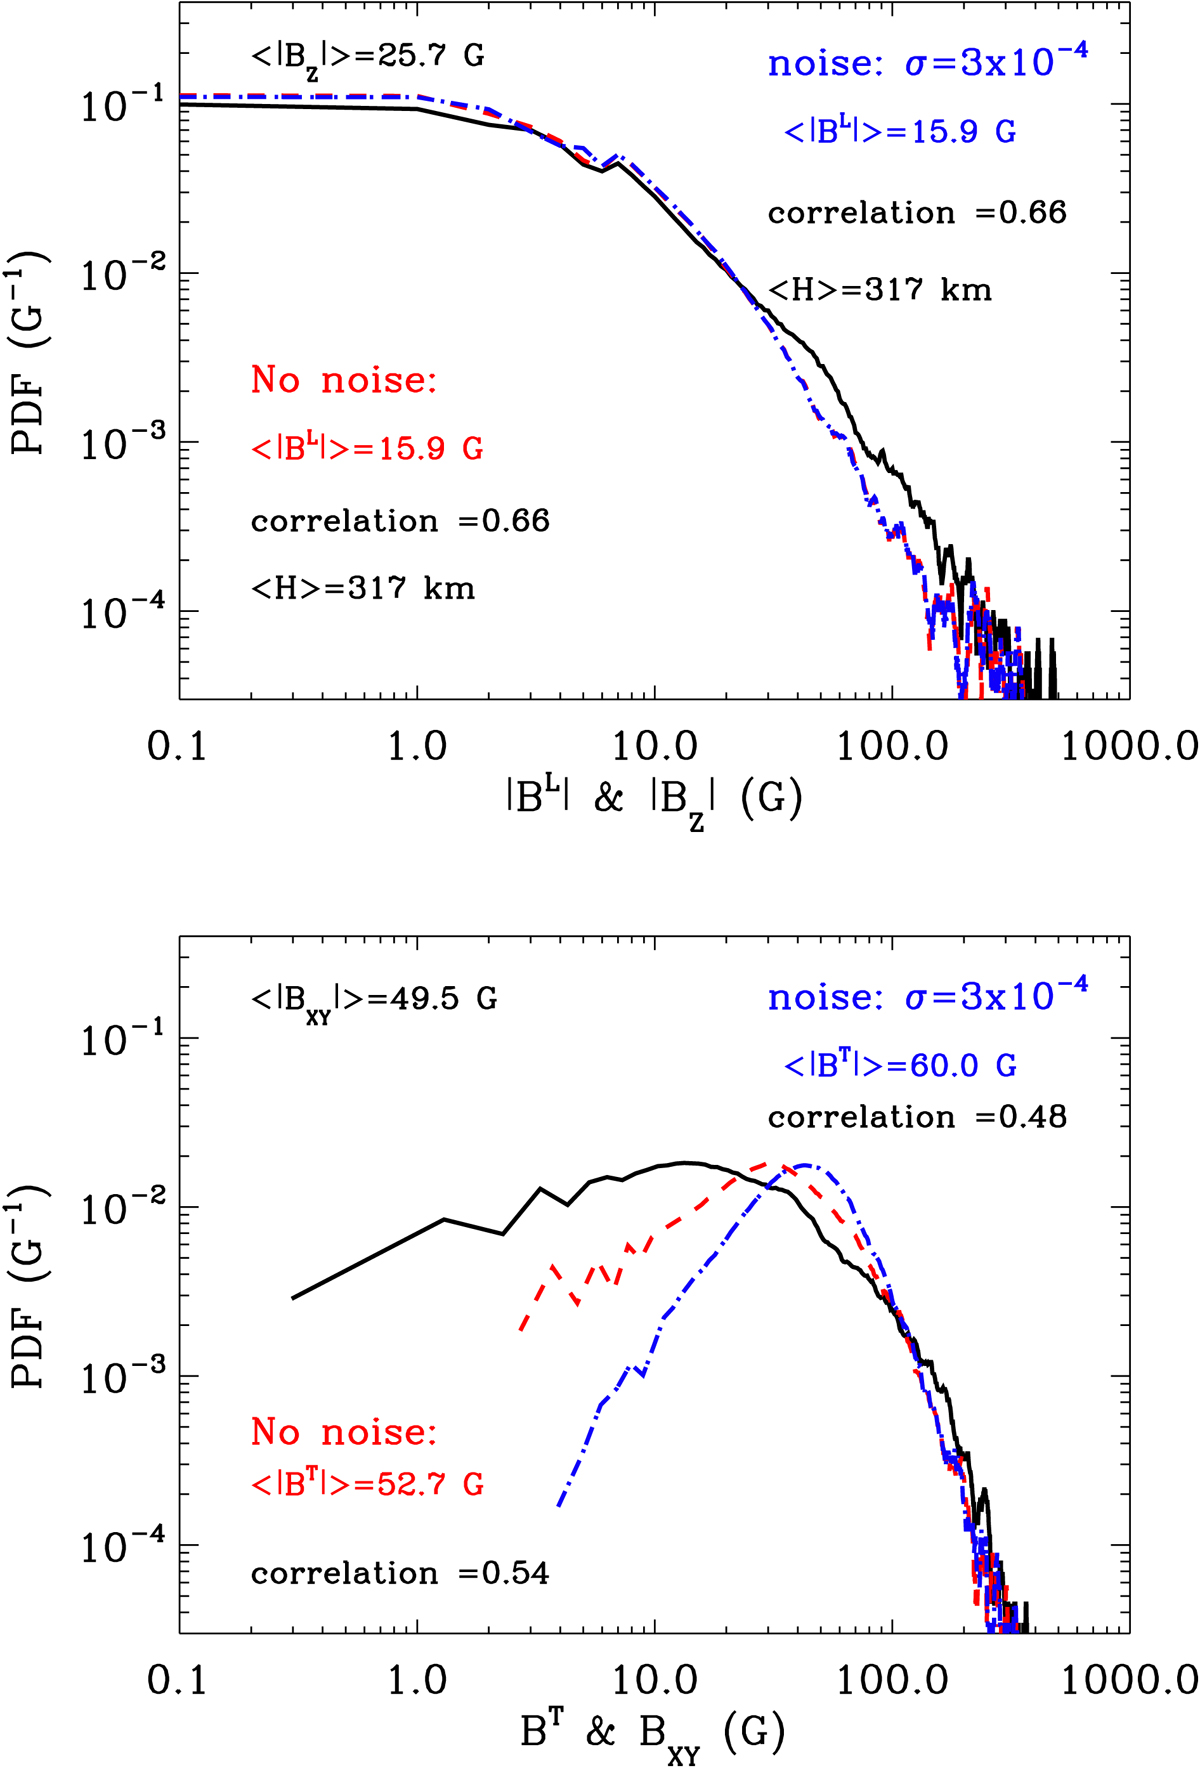
Top: probability density functions (PDF) for the unsigned longitudinal BL (dashed and dot-dashed curves) and the unsigned vertical BZ (solid curve) components of the magnetic field vector in the 3D snapshot model of Rempel (2014). Bottom: same but for the transverse BT and the horizontal BXY components of the magnetic field. The BL and BT values have been inferred from the unsmeared Stokes signals at the blue wing of the Si I 10 827 Å line using the weak field approximation. Dashed and dot-dashed curves correspond to the noise-free and the noisy Stokes profiles, respectively. The BZ and BXY values are, respectively, the vertical and horizontal components of the magnetic field of the model taken at the corrugated surface of optical depth τΔλ = 1, where Δλ is the wavelength location of the intensity derivative peaks in the blue wing of the Si I 10 827 Å line.
Current usage metrics show cumulative count of Article Views (full-text article views including HTML views, PDF and ePub downloads, according to the available data) and Abstracts Views on Vision4Press platform.
Data correspond to usage on the plateform after 2015. The current usage metrics is available 48-96 hours after online publication and is updated daily on week days.
Initial download of the metrics may take a while.