Fig. 8.
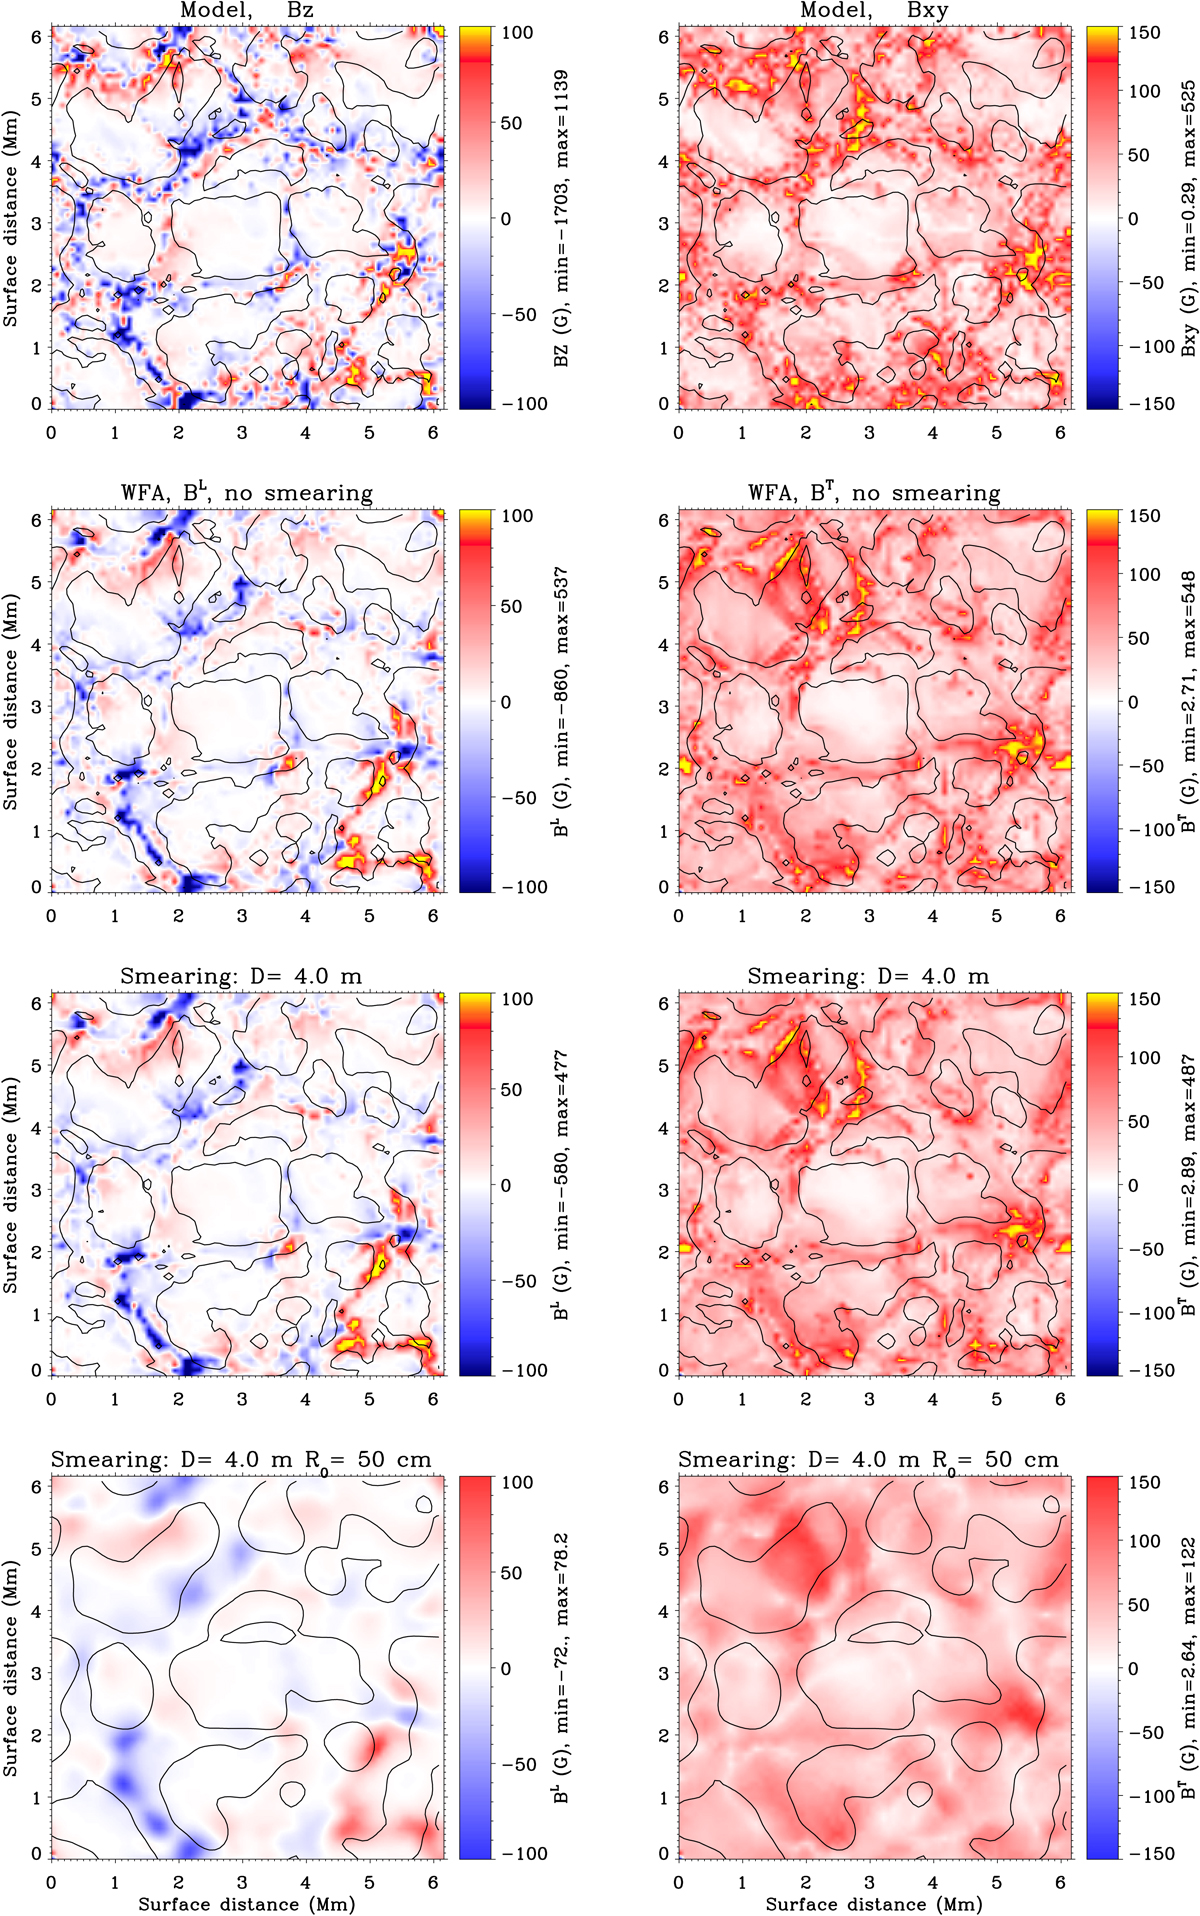
Top, from left to right: variation of the vertical BZ and horizontal BXY components of the magnetic field strength in the 3D snapshot model throughout the corrugated surface where the line optical depth τΔλ = 1, Δλ being the wavelength location of the intensity derivative peaks. Second to fourth rows: maps of the longitudinal BL (left column) and transverse BT (right column) components of the magnetic fields obtained by applying the WFA to the synthetic Stokes profiles of the Si I 10 827 Å line, calculated for three cases of spatial resolution. The lower and upper limits of the inferred magnetic fields are indicated at the right side of the respective images. For more information see the caption of Fig. 6.
Current usage metrics show cumulative count of Article Views (full-text article views including HTML views, PDF and ePub downloads, according to the available data) and Abstracts Views on Vision4Press platform.
Data correspond to usage on the plateform after 2015. The current usage metrics is available 48-96 hours after online publication and is updated daily on week days.
Initial download of the metrics may take a while.